## Line Chart: Gemma-2B-IT-Chat Loss Over Epochs
### Overview
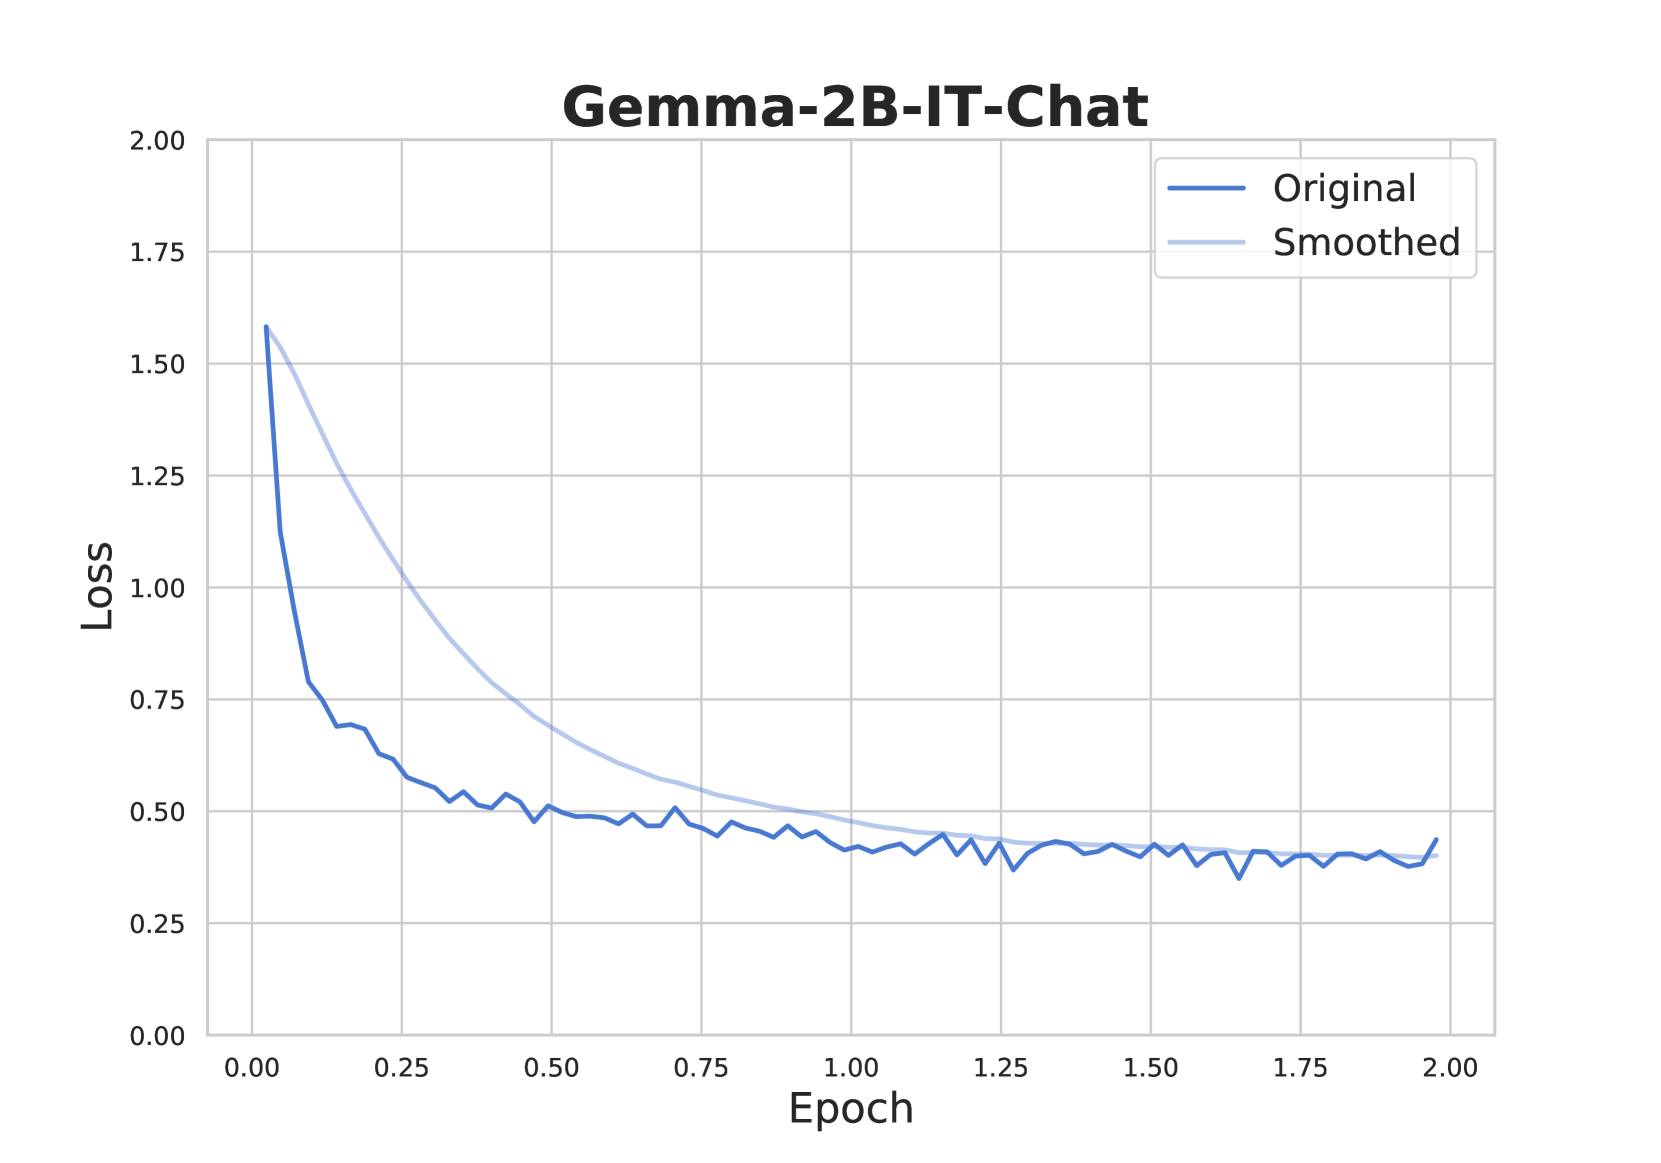
The chart visualizes the training loss of the Gemma-2B-IT-Chat model across 2.00 epochs. Two lines are plotted: "Original" (dark blue) and "Smoothed" (light blue). The y-axis represents loss values (0.00–2.00), while the x-axis represents epochs (0.00–2.00). The legend is positioned in the top-right corner.
### Components/Axes
- **Title**: "Gemma-2B-IT-Chat" (top-center).
- **X-axis**: Labeled "Epoch," with markers at 0.00, 0.25, 0.50, 0.75, 1.00, 1.25, 1.50, 1.75, and 2.00.
- **Y-axis**: Labeled "Loss," with markers at 0.00, 0.25, 0.50, 0.75, 1.00, 1.25, 1.50, 1.75, and 2.00.
- **Legend**: Top-right corner, with "Original" (dark blue) and "Smoothed" (light blue) labels.
### Detailed Analysis
- **Original Line (Dark Blue)**:
- Starts at ~1.6 loss at epoch 0.00.
- Sharp decline to ~0.5 loss by epoch 0.50.
- Fluctuates between ~0.4–0.5 loss from epoch 0.50 to 2.00.
- Ends at ~0.4 loss at epoch 2.00.
- **Smoothed Line (Light Blue)**:
- Starts at ~1.5 loss at epoch 0.00.
- Gradual decline to ~0.5 loss by epoch 1.50.
- Stabilizes around ~0.4–0.5 loss from epoch 1.50 to 2.00.
- Ends at ~0.4 loss at epoch 2.00.
### Key Observations
1. **Initial Sharp Decline**: The Original line experiences a rapid loss reduction in the first 0.5 epochs (~1.6 → ~0.5).
2. **Smoothing Effect**: The Smoothed line exhibits a more gradual decline, avoiding abrupt changes.
3. **Convergence**: Both lines converge to similar loss values (~0.4–0.5) by epoch 1.50 and remain stable thereafter.
4. **Fluctuations**: The Original line shows minor oscillations (~0.4–0.5) after epoch 0.50, while the Smoothed line remains smoother.
### Interpretation
The chart demonstrates the training dynamics of the Gemma-2B-IT-Chat model. The Original line’s sharp initial drop suggests rapid early learning, while the Smoothed line’s gradual decline indicates a more stable optimization process. The convergence of both lines by epoch 1.50 implies that both approaches achieve comparable performance by the end of training. The Smoothed line’s reduced volatility may reflect techniques like moving averages or gradient clipping to mitigate noise in the loss signal. The final loss values (~0.4) suggest moderate model performance, with potential for further optimization.