## Scatter Plot and Bar Chart: Controller Coverage and Accuracy
### Overview
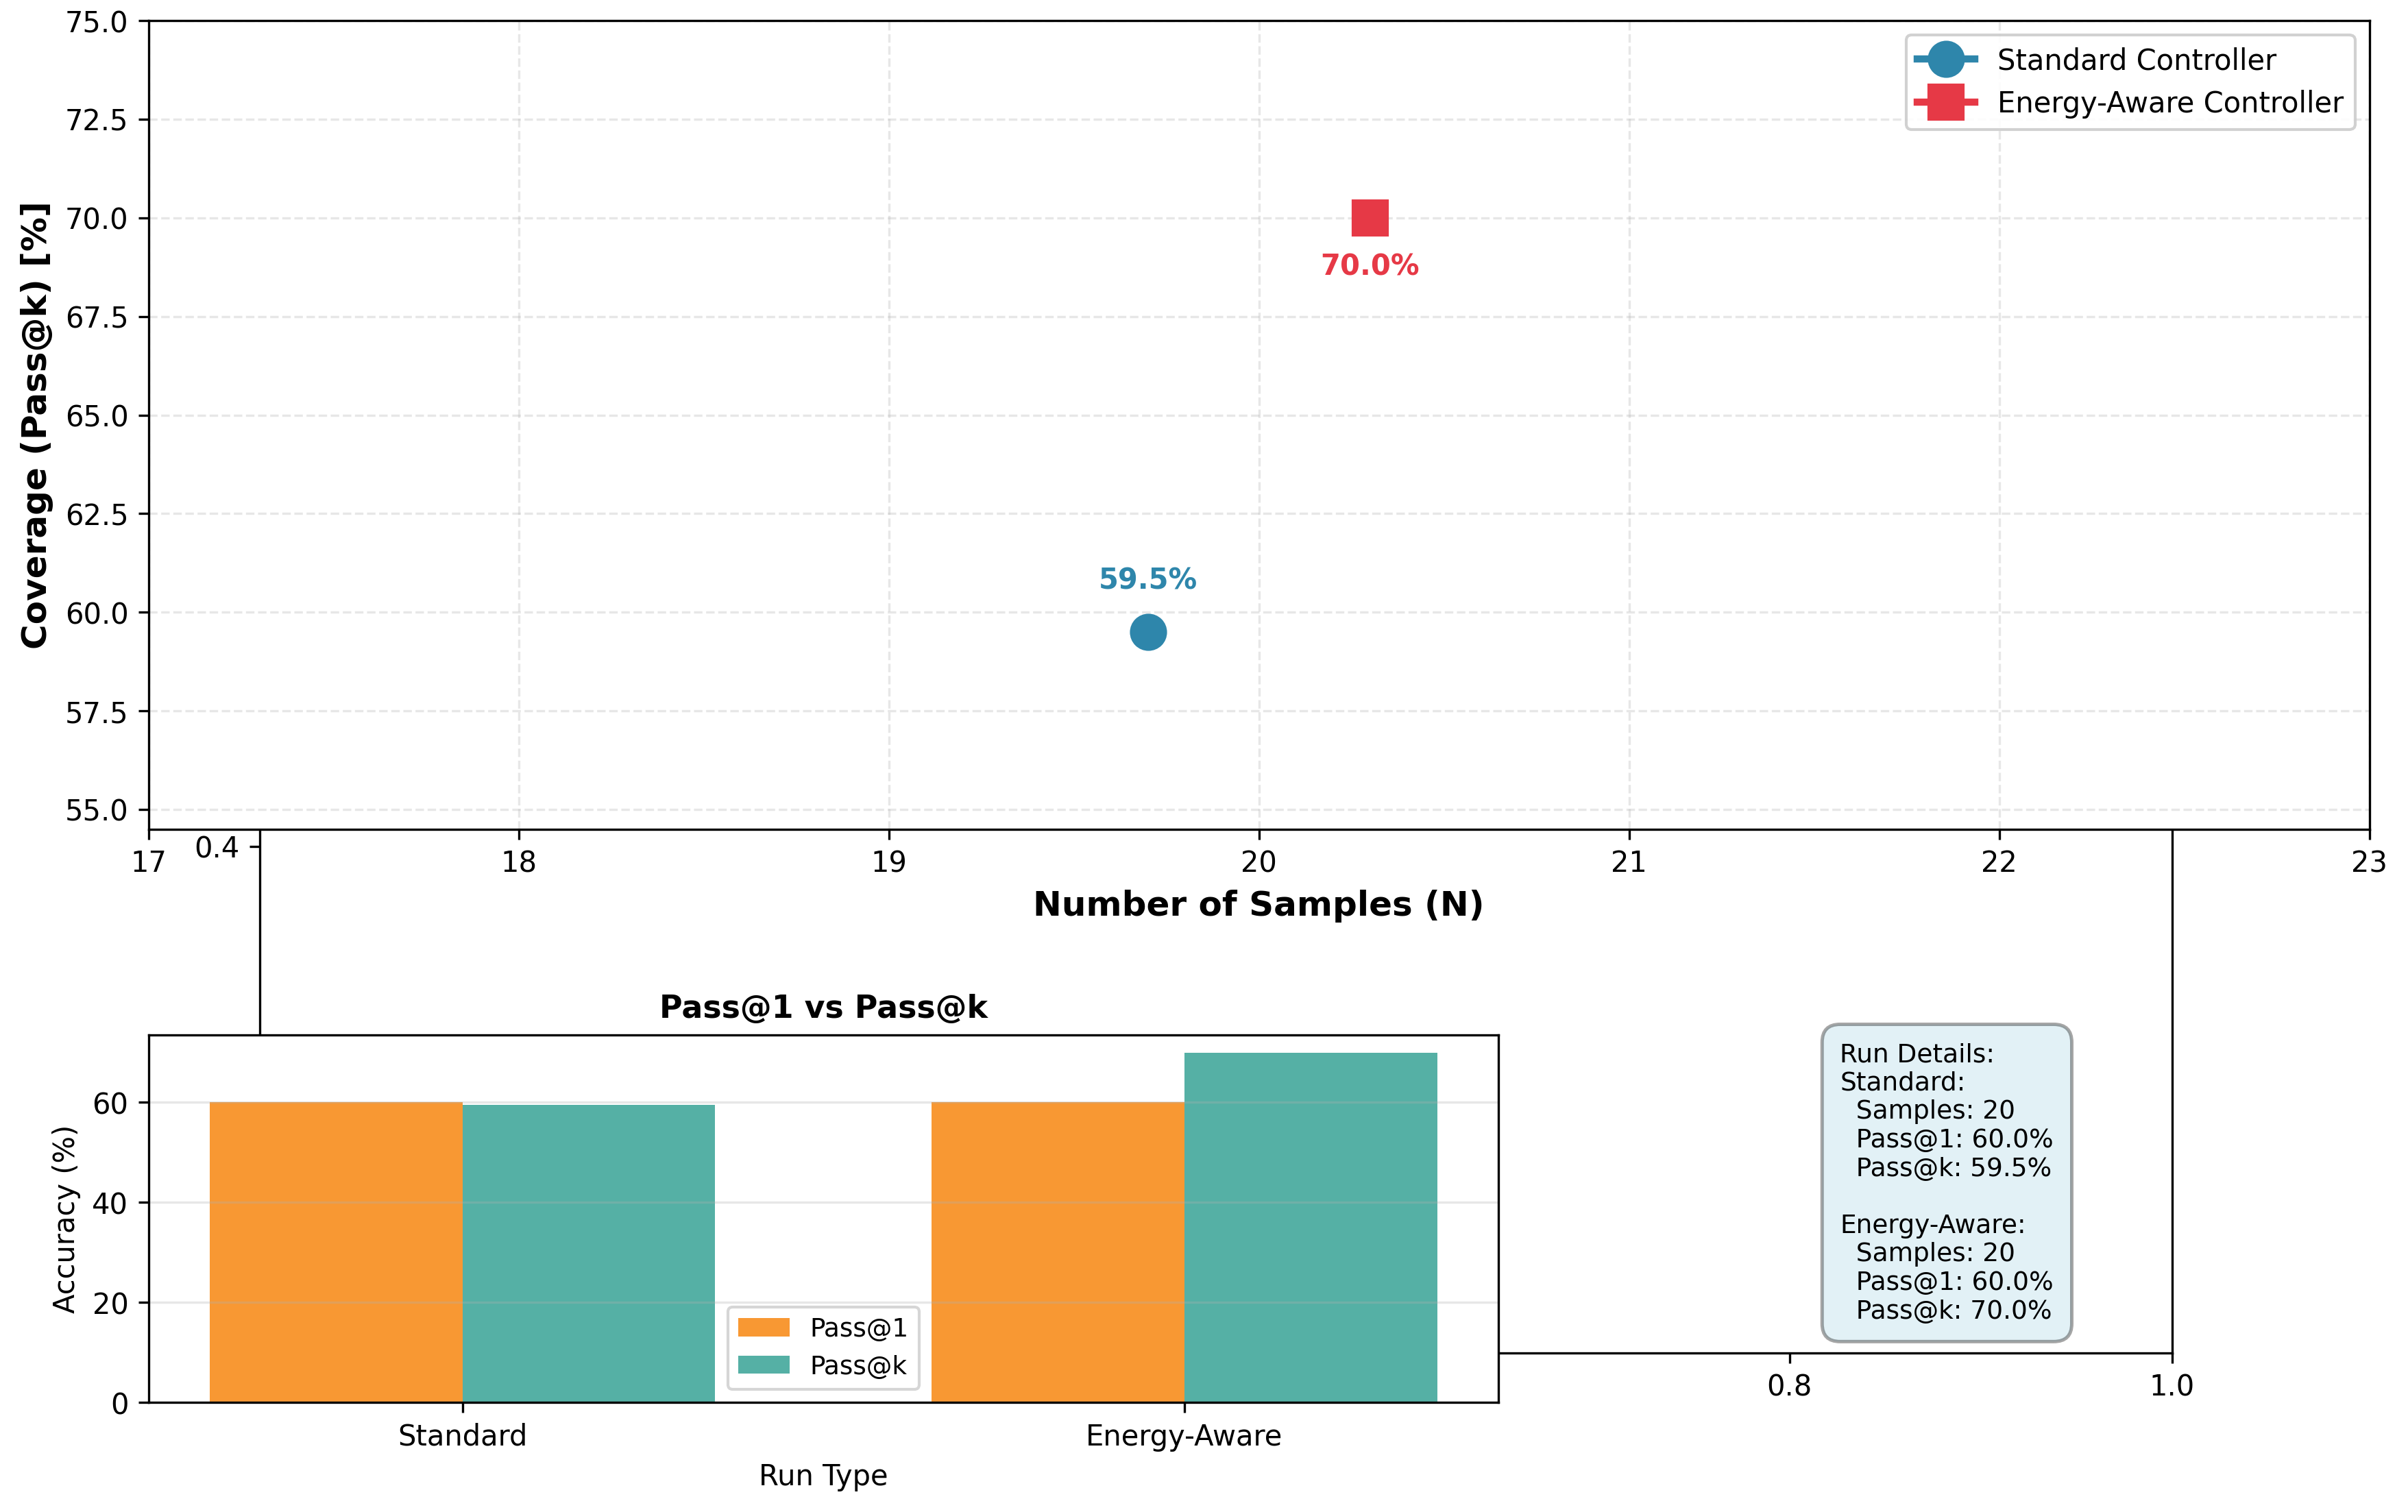
The image contains a scatter plot showing the coverage (Pass@k) percentage for two types of controllers (Standard and Energy-Aware) based on the number of samples. Additionally, a bar chart compares the Pass@1 and Pass@k accuracy for both controller types. A text box provides the exact values for each controller.
### Components/Axes
**Scatter Plot:**
* **Title:** None explicitly given, but the plot visualizes the coverage of different controllers.
* **X-axis:** "Number of Samples (N)". Scale ranges from 17 to 23, with tick marks at each integer value.
* **Y-axis:** "Coverage (Pass@k) [%]". Scale ranges from 55.0 to 75.0, with tick marks at intervals of 2.5.
* **Legend:** Located in the top-right corner.
* Blue circle: "Standard Controller"
* Red square: "Energy-Aware Controller"
**Bar Chart:**
* **Title:** "Pass@1 vs Pass@k"
* **X-axis:** "Run Type". Categories are "Standard" and "Energy-Aware".
* **Y-axis:** "Accuracy (%)". Scale ranges from 0 to 60, with tick marks at intervals of 20.
* **Legend:** Located in the bottom-center of the bar chart.
* Orange: "Pass@1"
* Teal: "Pass@k"
**Text Box:**
* **Title:** "Run Details:"
* Provides the number of samples, Pass@1, and Pass@k values for both Standard and Energy-Aware controllers.
### Detailed Analysis
**Scatter Plot:**
* **Standard Controller (Blue Circle):** Located at approximately (20, 59.5) with a label of "59.5%".
* **Energy-Aware Controller (Red Square):** Located at approximately (20, 70.0) with a label of "70.0%".
**Bar Chart:**
* **Standard Controller:**
* Pass@1 (Orange): Approximately 60%
* Pass@k (Teal): Approximately 59.5%
* **Energy-Aware Controller:**
* Pass@1 (Orange): Approximately 60%
* Pass@k (Teal): Approximately 70%
**Text Box:**
* **Standard:**
* Samples: 20
* Pass@1: 60.0%
* Pass@k: 59.5%
* **Energy-Aware:**
* Samples: 20
* Pass@1: 60.0%
* Pass@k: 70.0%
### Key Observations
* Both controllers were run with 20 samples.
* The Energy-Aware Controller has a significantly higher coverage (Pass@k) compared to the Standard Controller.
* Pass@1 accuracy is the same for both controllers.
* The Pass@k accuracy is higher than Pass@1 for the Energy-Aware controller, but slightly lower for the Standard controller.
### Interpretation
The data suggests that the Energy-Aware Controller performs better in terms of coverage (Pass@k) compared to the Standard Controller, given the same number of samples. The bar chart and text box confirm that while Pass@1 accuracy is identical, the Energy-Aware Controller achieves a higher Pass@k accuracy. This indicates that the Energy-Aware Controller is more effective at covering a larger portion of the possible outcomes or states.