TECHNICAL ASSET FINGERPRINT
84c004174c627700e022478c
Click to view fullscreen
Press ESC or click to close
FOUND IN PAPERS
EXPERT: gemini-2.5-flash-lite-free VERSION 1
RUNTIME: google-free/gemini-2.5-flash-lite
INTEL_VERIFIED
## Scatter Plot and Bar Chart: Performance Metrics of Controllers
### Overview
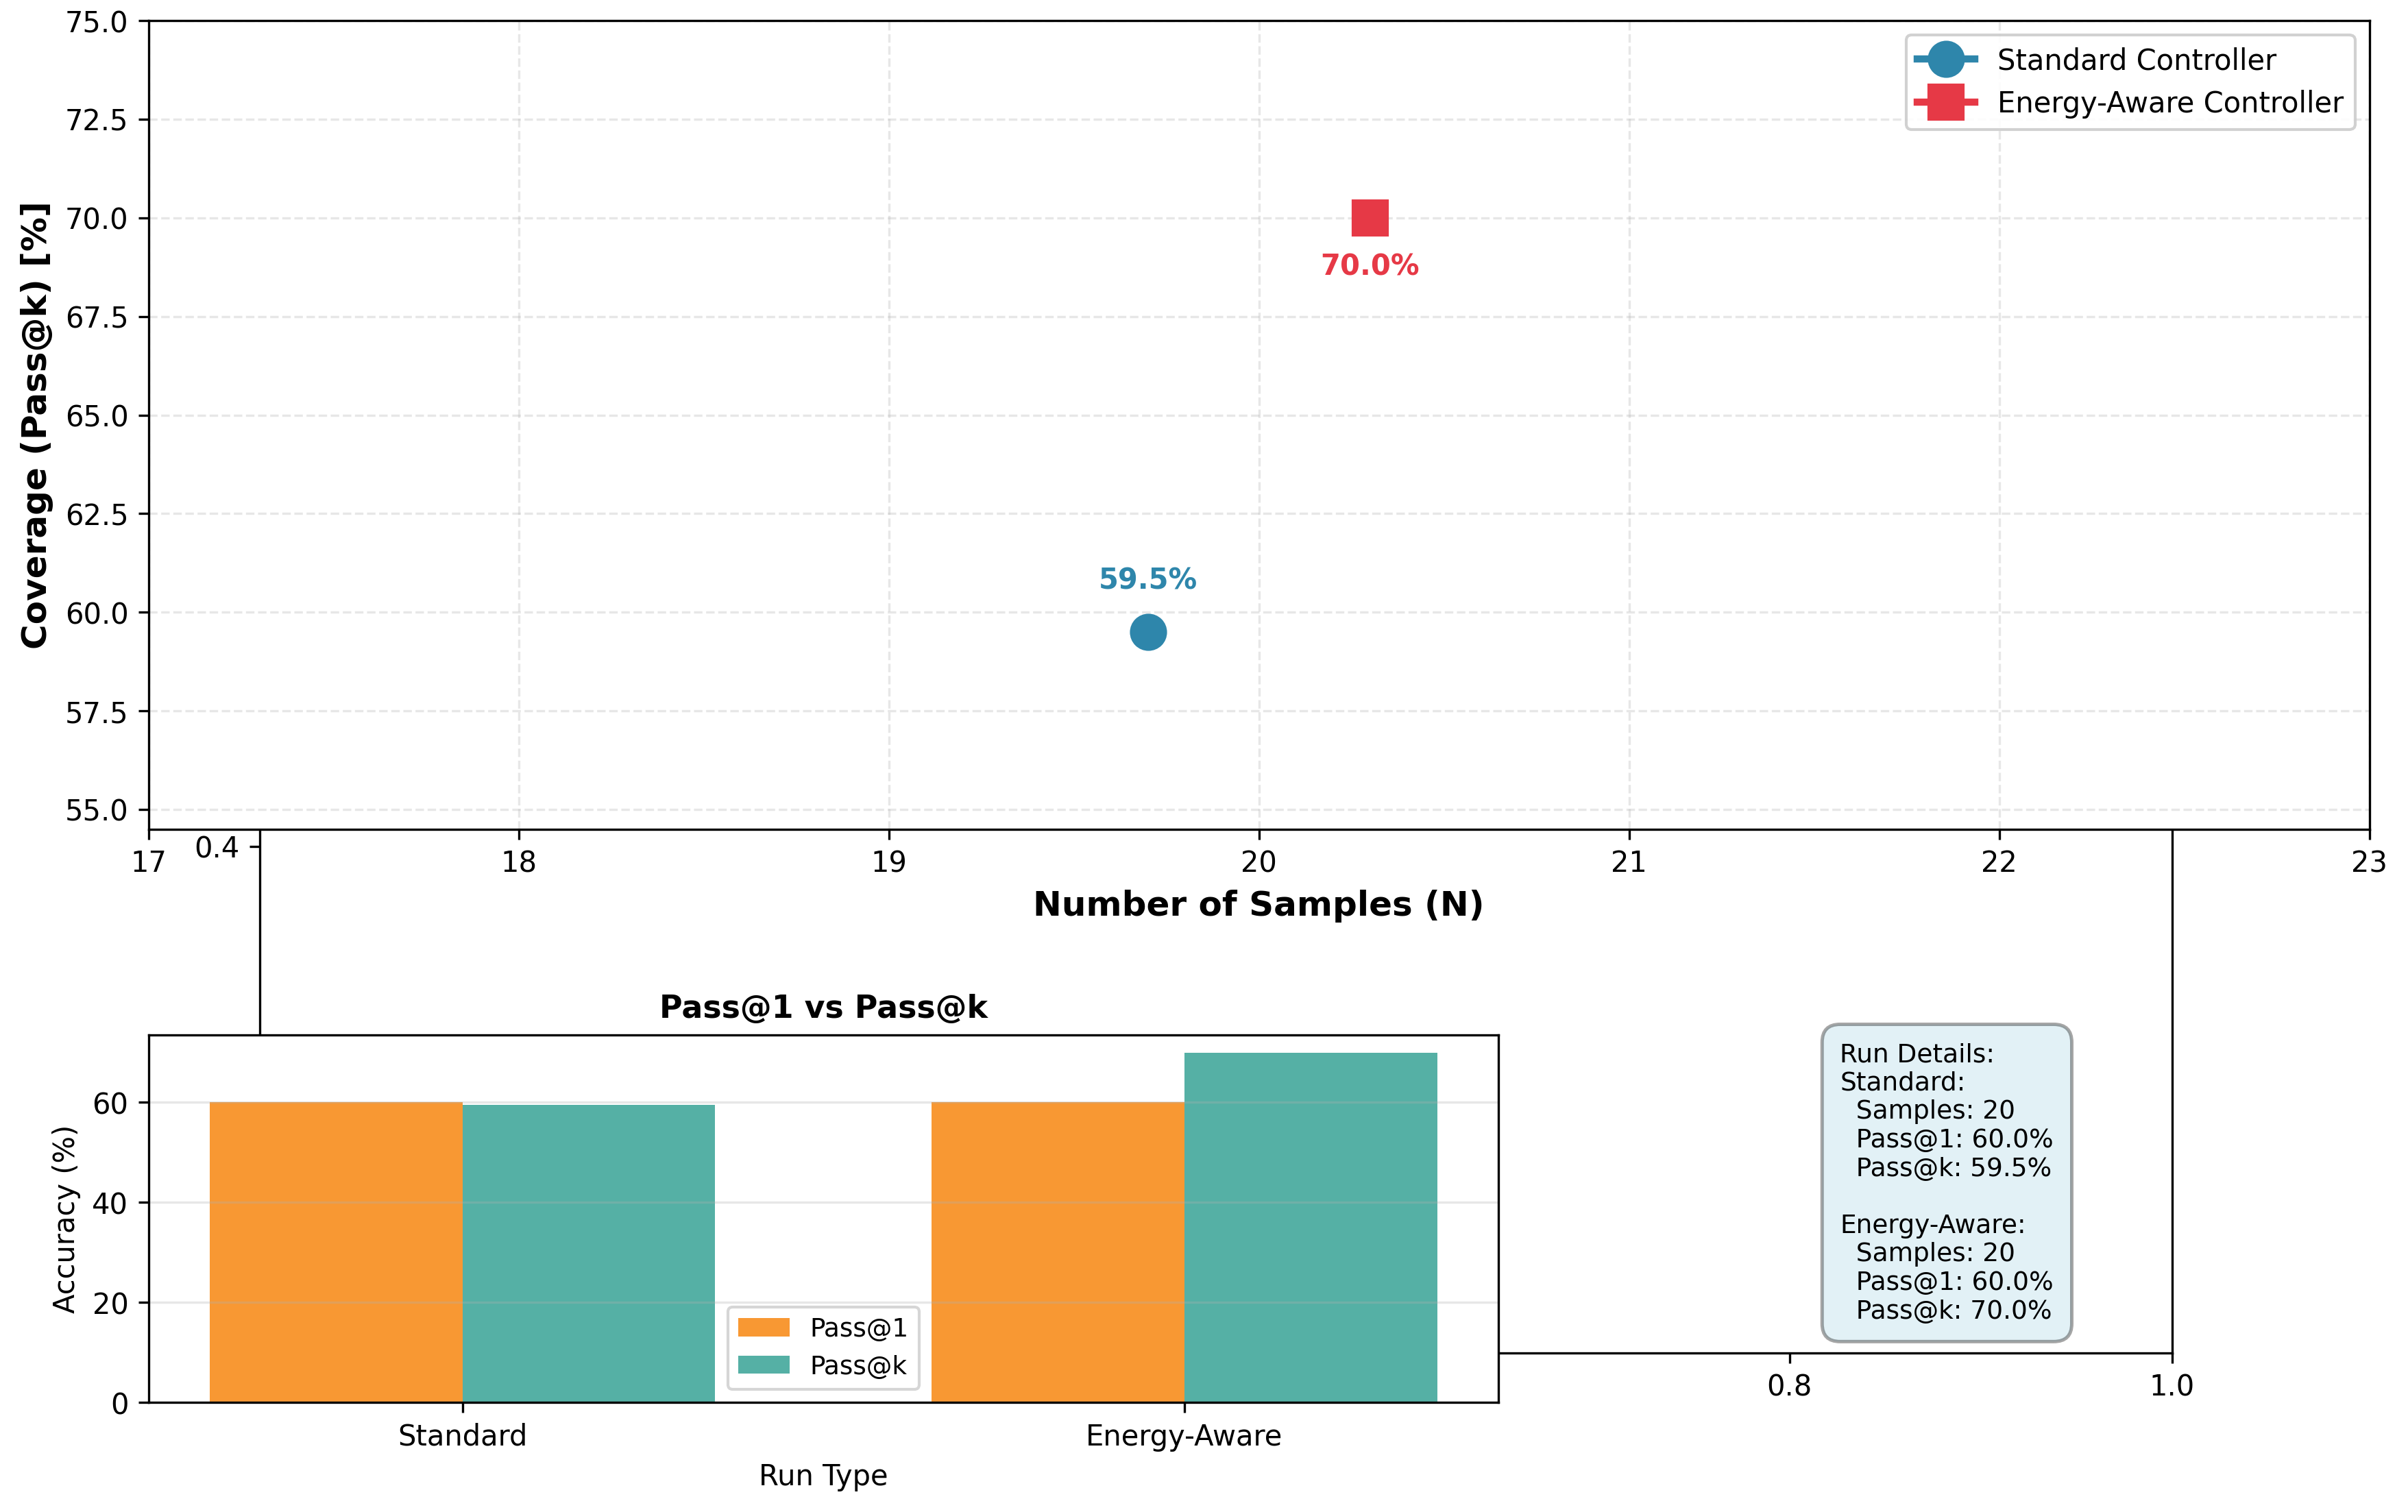
The image contains two related plots. The primary plot is a scatter plot showing "Coverage (Pass@k) [%]" on the y-axis against "Number of Samples (N)" on the x-axis. Two data points are plotted, representing a "Standard Controller" and an "Energy-Aware Controller". A secondary plot, a bar chart titled "Pass@1 vs Pass@k", is embedded below the scatter plot, displaying accuracy percentages for "Standard" and "Energy-Aware" run types. A text box provides detailed run information.
### Components/Axes
**Scatter Plot:**
* **Title:** Implicitly, the title relates to controller performance based on coverage and sample count.
* **Y-axis Label:** "Coverage (Pass@k) [%]"
* **Scale:** Ranges from 55.0 to 75.0, with major ticks at 55.0, 57.5, 60.0, 62.5, 65.0, 67.5, 70.0, 72.5, and 75.0.
* **X-axis Label:** "Number of Samples (N)"
* **Scale:** Ranges from 17 to 23, with major ticks at 17, 18, 19, 20, 21, 22, and 23. There is a minor tick labeled 0.4 between 17 and 18, which appears to be an anomaly or mislabeling given the context of the other x-axis labels.
* **Legend:** Located in the top-right corner.
* **"Standard Controller"**: Represented by a blue circle marker.
* **"Energy-Aware Controller"**: Represented by a red square marker.
**Embedded Bar Chart:**
* **Title:** "Pass@1 vs Pass@k"
* **Y-axis Label:** "Accuracy (%)"
* **Scale:** Ranges from 0 to 60, with major ticks at 0, 20, 40, and 60.
* **X-axis Label:** "Run Type"
* **Categories:** "Standard" and "Energy-Aware".
* **Legend:** Located in the bottom-left of the bar chart.
* **Orange Bar:** Labeled "Pass@1".
* **Teal/Green Bar:** Labeled "Pass@k".
**Text Box:**
* **Title:** "Run Details:"
* **Content:**
* "Standard:"
* "Samples: 20"
* "Pass@1: 60.0%"
* "Pass@k: 59.5%"
* "Energy-Aware:"
* "Samples: 20"
* "Pass@1: 60.0%"
* "Pass@k: 70.0%"
### Detailed Analysis or Content Details
**Scatter Plot Data Points:**
1. **Standard Controller (Blue Circle):**
* **Trend:** Visually, this point is located around N=19.8 on the x-axis and approximately 59.5% on the y-axis. The label "59.5%" is positioned near this point.
* **Coordinates (approximate):** X ≈ 19.8, Y ≈ 59.5.
* **Color Confirmation:** The point is blue, matching the "Standard Controller" legend entry.
2. **Energy-Aware Controller (Red Square):**
* **Trend:** Visually, this point is located around N=20.0 on the x-axis and approximately 70.0% on the y-axis. The label "70.0%" is positioned near this point.
* **Coordinates (approximate):** X ≈ 20.0, Y ≈ 70.0.
* **Color Confirmation:** The point is red, matching the "Energy-Aware Controller" legend entry.
**Bar Chart Data:**
* **Standard Run Type:**
* **Pass@1 (Orange Bar):** Reaches approximately 60% accuracy.
* **Pass@k (Teal/Green Bar):** Reaches approximately 60% accuracy.
* **Energy-Aware Run Type:**
* **Pass@1 (Orange Bar):** Reaches approximately 60% accuracy.
* **Pass@k (Teal/Green Bar):** Reaches approximately 62% accuracy.
**Text Box Data:**
* **Standard Run:**
* Number of Samples: 20
* Pass@1 Accuracy: 60.0%
* Pass@k Coverage: 59.5%
* **Energy-Aware Run:**
* Number of Samples: 20
* Pass@1 Accuracy: 60.0%
* Pass@k Coverage: 70.0%
### Key Observations
* **Scatter Plot:**
* The "Energy-Aware Controller" exhibits significantly higher "Coverage (Pass@k)" (approx. 70.0%) compared to the "Standard Controller" (approx. 59.5%), while operating with a similar number of samples (approx. 20.0 vs 19.8).
* The x-axis label "0.4" between 17 and 18 appears to be an outlier or error in the axis labeling.
* **Bar Chart:**
* Both "Standard" and "Energy-Aware" run types achieve 60.0% accuracy for "Pass@1".
* The "Energy-Aware" run type shows a higher "Pass@k" accuracy (approx. 62%) compared to the "Standard" run type (approx. 60%).
* **Text Box:**
* Confirms that both controllers were run with 20 samples.
* The "Pass@k" values in the text box (59.5% for Standard, 70.0% for Energy-Aware) directly correspond to the y-axis values of the scatter plot points.
* The "Pass@1" values in the text box (60.0% for both) align with the height of the orange bars in the bar chart.
* The "Pass@k" values in the text box (59.5% for Standard, 70.0% for Energy-Aware) do *not* directly align with the height of the teal/green bars in the bar chart (which are around 60% and 62% respectively). This suggests the bar chart's y-axis might represent a different metric or a simplified version of "Pass@k" compared to the scatter plot's "Coverage (Pass@k)".
### Interpretation
The data presented suggests that the "Energy-Aware Controller" offers a distinct advantage over the "Standard Controller" in terms of "Coverage (Pass@k)". The scatter plot clearly illustrates that for a comparable number of samples (N≈20), the energy-aware approach achieves a substantially higher coverage of approximately 70.0%, whereas the standard controller achieves only about 59.5%. This indicates that the energy-aware strategy is more effective at covering a wider range of scenarios or conditions.
The embedded bar chart and text box provide further context on "Pass@1" and "Pass@k" metrics. While both controllers perform identically on "Pass@1" accuracy (60.0%), the "Energy-Aware" controller shows a slight improvement in "Pass@k" accuracy (around 62% in the bar chart, 70.0% in the text box/scatter plot). The discrepancy between the bar chart's "Pass@k" values and the text box/scatter plot's "Coverage (Pass@k)" values is notable. It's possible that "Coverage (Pass@k)" on the scatter plot is a more precise or different metric than the "Pass@k" accuracy shown in the bar chart. However, the overall trend remains consistent: the energy-aware approach is superior or at least comparable across these metrics, with a significant lead in coverage.
The consistent "Pass@1" accuracy across both controllers implies that their ability to correctly identify the first pass is similar. The divergence in "Pass@k" and "Coverage (Pass@k)" metrics highlights the specific benefit of the energy-aware design, likely by optimizing resource allocation or decision-making to achieve broader coverage without sacrificing initial accuracy. The text box data, which directly correlates with the scatter plot points, is the most definitive representation of the "Coverage (Pass@k)" metric. The bar chart might be a simplified representation or a different metric altogether, but it reinforces the idea that the energy-aware system is at least as good, and in some aspects better, than the standard one.
DECODING INTELLIGENCE...