## Line Chart & Bar Chart: Coverage (Pass@k) vs. Number of Samples & Pass@1 vs Pass@k
### Overview
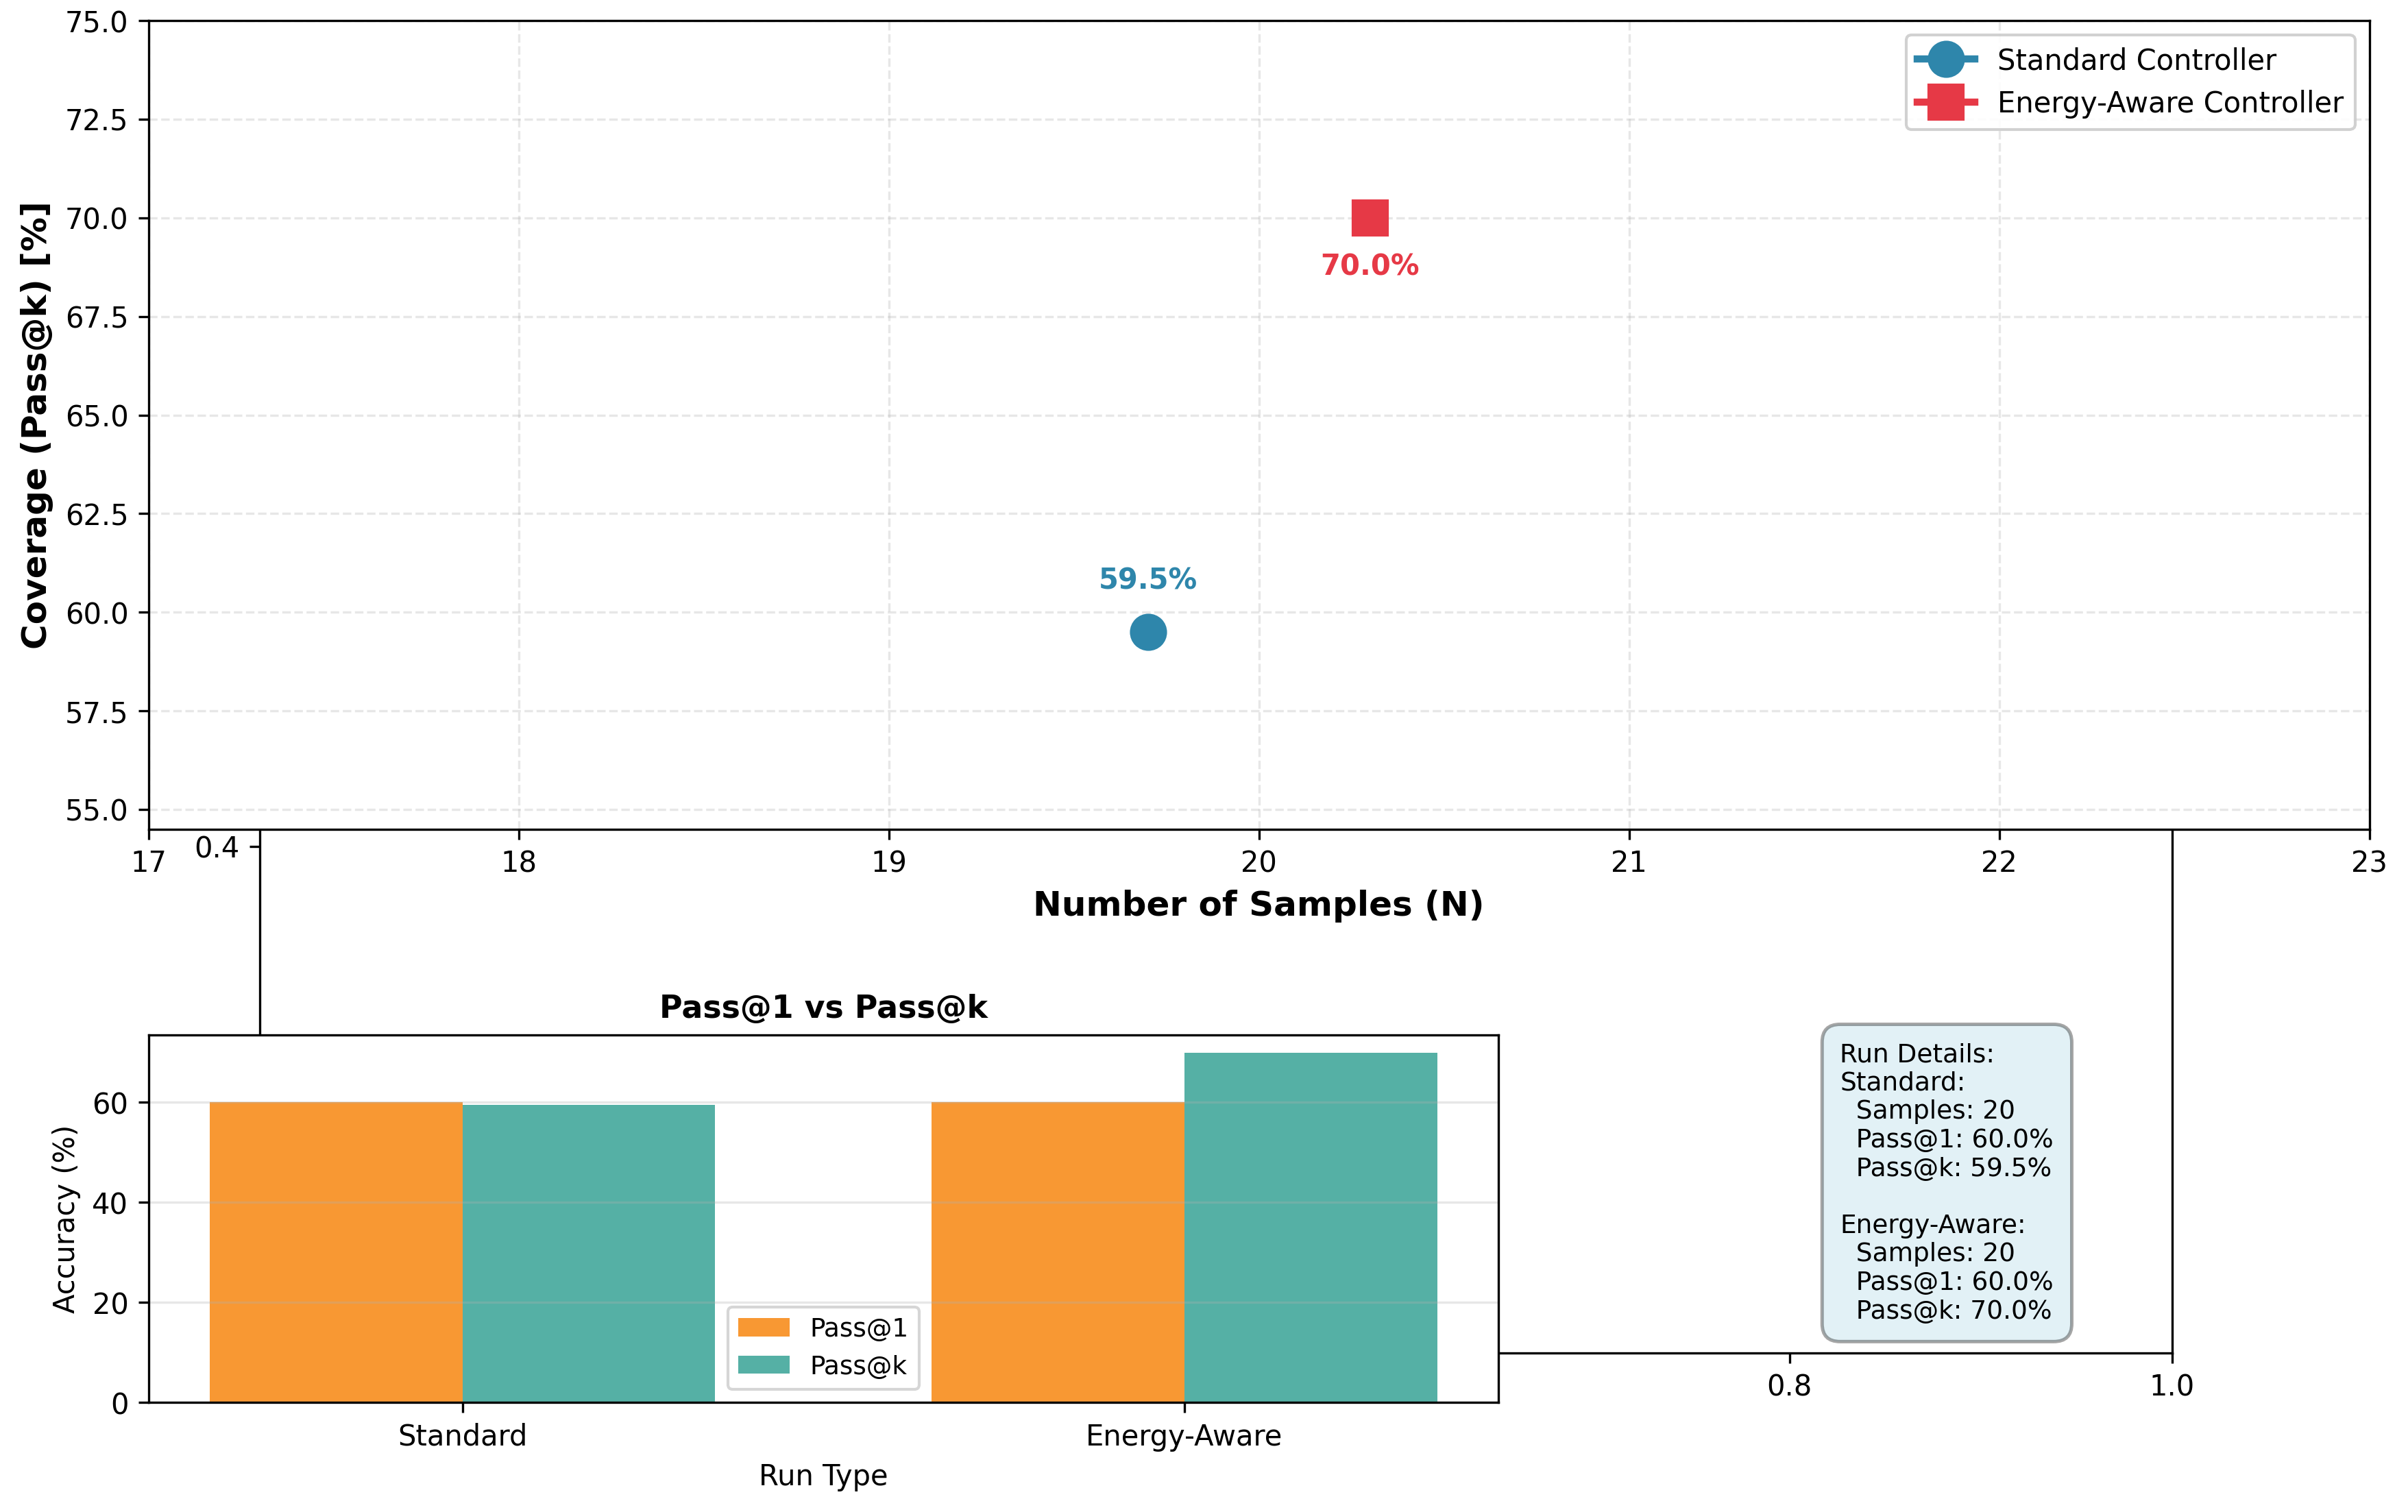
The image contains two charts: a line chart showing Coverage (Pass@k) as a function of the Number of Samples (N), and a stacked bar chart comparing Pass@1 and Pass@k accuracy for Standard and Energy-Aware controllers. A text box in the bottom-right corner provides run details.
### Components/Axes
**Line Chart:**
* **X-axis:** Number of Samples (N), ranging from approximately 17.4 to 22.6.
* **Y-axis:** Coverage (Pass@k) [%], ranging from approximately 55.0% to 75.0%.
* **Data Series:**
* Standard Controller (Blue)
* Energy-Aware Controller (Red)
* **Legend:** Located in the top-right corner.
**Bar Chart:**
* **X-axis:** Run Type (Standard, Energy-Aware)
* **Y-axis:** Accuracy (%) ranging from 0% to 60%.
* **Data Series:**
* Pass@1 (Orange)
* Pass@k (Green)
* **Legend:** Located in the bottom-left corner.
**Text Box:**
* Title: "Run Details:"
* Content: Details for Standard and Energy-Aware runs, including Samples, Pass@1, and Pass@k values.
### Detailed Analysis or Content Details
**Line Chart Analysis:**
* **Standard Controller (Blue):** The line is relatively flat, with a slight upward trend. The data points are not explicitly marked, but we can estimate:
* N = 17.4: Coverage ≈ 58.0%
* N = 20: Coverage ≈ 60.0%
* N = 22.6: Coverage ≈ 61.0%
* **Energy-Aware Controller (Red):** The line shows a more pronounced upward trend.
* N = 17.4: Coverage ≈ 59.5%
* N = 20: Coverage ≈ 70.0%
* N = 22.6: Coverage ≈ 72.0%
**Bar Chart Analysis:**
* **Standard Controller:**
* Pass@1: Approximately 60.0%
* Pass@k: Approximately 59.5%
* **Energy-Aware Controller:**
* Pass@1: Approximately 60.0%
* Pass@k: Approximately 70.0%
**Text Box Details:**
* **Standard:**
* Samples: 20
* Pass@1: 60.0%
* Pass@k: 59.5%
* **Energy-Aware:**
* Samples: 20
* Pass@1: 60.0%
* Pass@k: 70.0%
### Key Observations
* The Energy-Aware controller consistently demonstrates higher Coverage (Pass@k) than the Standard controller, especially as the number of samples increases.
* Both controllers exhibit similar Pass@1 accuracy.
* The difference in Pass@k accuracy between the two controllers is significant, with the Energy-Aware controller achieving approximately 10-11% higher coverage.
* The line chart visually confirms the bar chart data, showing a clear separation in performance between the two controllers.
### Interpretation
The data suggests that the Energy-Aware controller is more effective at achieving higher coverage (Pass@k) compared to the Standard controller, particularly with a larger number of samples. While both controllers perform similarly in terms of Pass@1 accuracy, the Energy-Aware controller's ability to improve coverage with more samples indicates a more robust and scalable solution.
The Pass@k metric likely represents the probability of finding at least one correct solution within the top 'k' results, while Pass@1 represents the probability of the top result being correct. The difference between these two metrics highlights the Energy-Aware controller's ability to improve the ranking of potential solutions, increasing the likelihood of finding a correct solution even if it's not the top-ranked one.
The consistent Pass@1 accuracy suggests that both controllers are equally good at identifying the most likely solution, but the Energy-Aware controller excels at exploring a wider range of possibilities and improving the overall coverage of correct solutions. This could be due to the Energy-Aware controller employing more sophisticated search or optimization strategies. The fact that the difference in Pass@k is more pronounced with a larger number of samples suggests that the benefits of the Energy-Aware approach become more apparent as the search space expands.