## Scatter Plot and Bar Chart: Controller Performance Comparison
### Overview
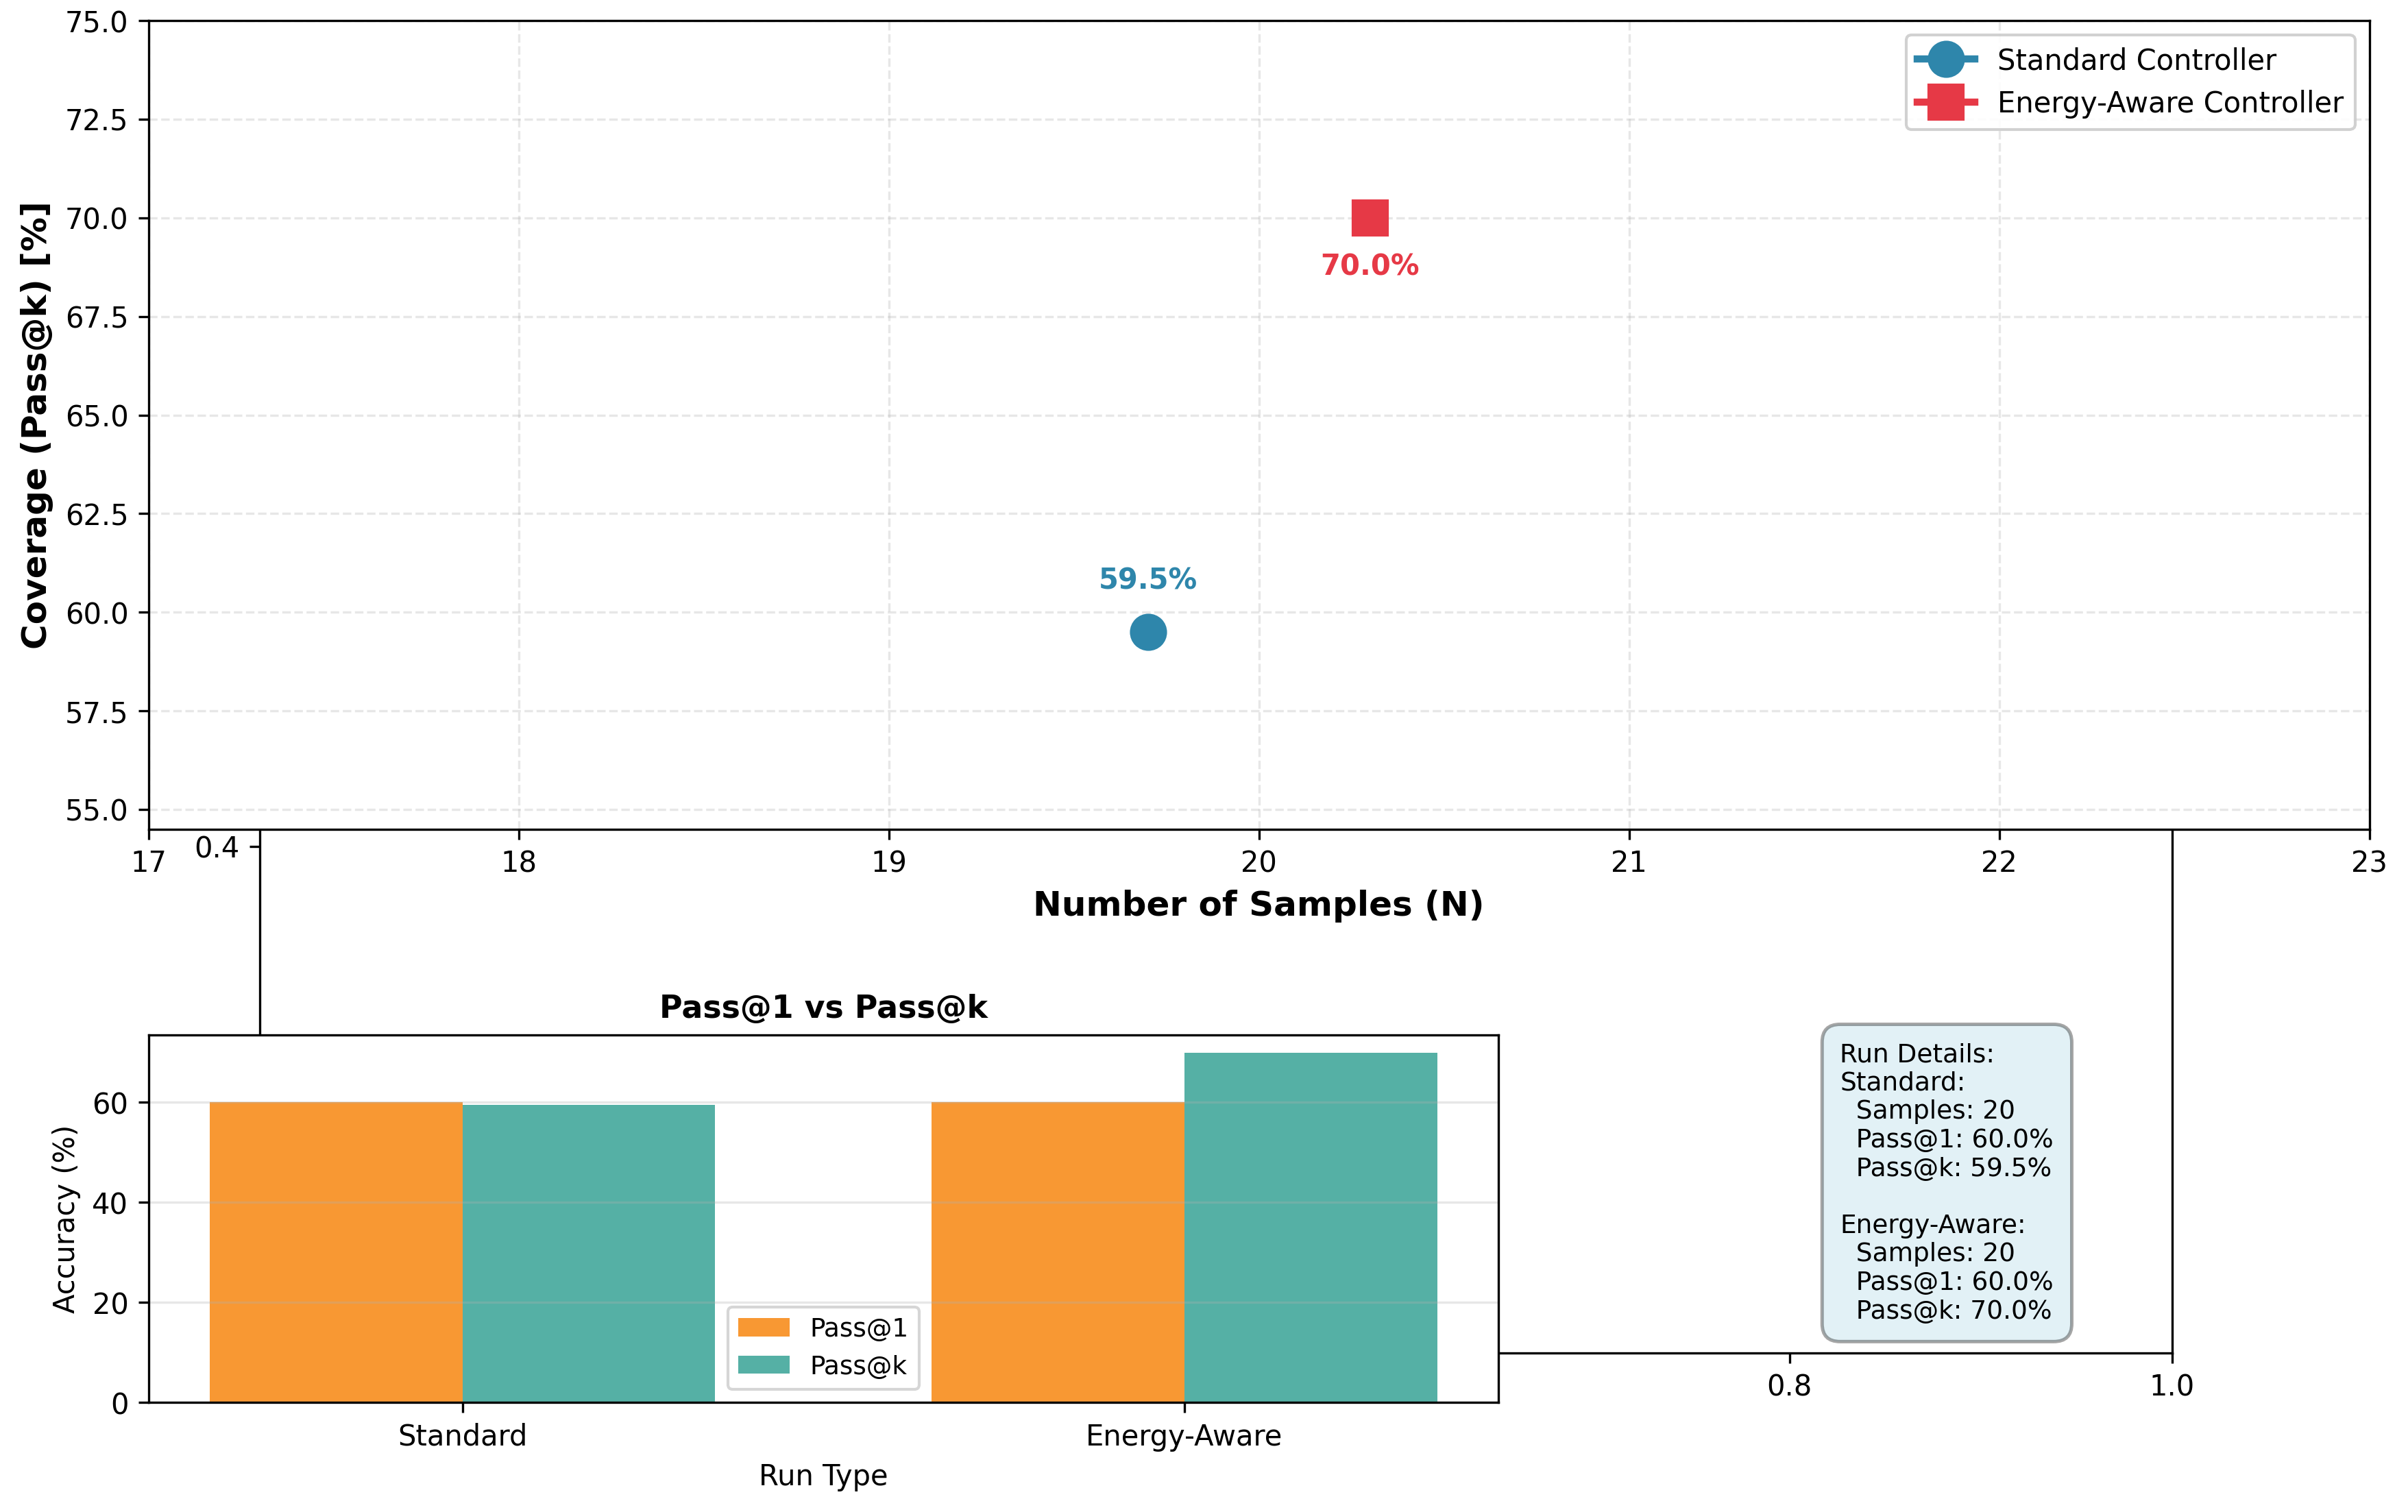
The image contains two distinct charts comparing the performance of a "Standard Controller" and an "Energy-Aware Controller." The top chart is a scatter plot showing the relationship between the number of samples and coverage (Pass@k). The bottom chart is a grouped bar chart comparing Pass@1 and Pass@k accuracy for both controllers. A text box provides precise numerical run details.
### Components/Axes
**Top Chart (Scatter Plot):**
* **X-axis:** Label: "Number of Samples (N)". Scale: Linear, from 17 to 23, with major ticks at 17, 18, 19, 20, 21, 22, 23.
* **Y-axis:** Label: "Coverage (Pass@k) [%]". Scale: Linear, from 55.0 to 75.0, with major ticks every 2.5 units (55.0, 57.5, 60.0, etc.).
* **Legend:** Located in the top-right corner.
* Blue circle icon: "Standard Controller"
* Red square icon: "Energy-Aware Controller"
* **Data Points:**
1. **Standard Controller (Blue Circle):** Positioned at approximately N=19.7 on the x-axis and 59.5% on the y-axis. The value "59.5%" is annotated directly above the point.
2. **Energy-Aware Controller (Red Square):** Positioned at approximately N=20.3 on the x-axis and 70.0% on the y-axis. The value "70.0%" is annotated directly below the point.
**Bottom Chart (Grouped Bar Chart):**
* **Title:** "Pass@1 vs Pass@k"
* **X-axis:** Label: "Run Type". Categories: "Standard" and "Energy-Aware".
* **Y-axis:** Label: "Accuracy (%)". Scale: Linear, from 0 to 60, with major ticks at 0, 20, 40, 60.
* **Legend:** Located at the bottom center of the chart.
* Orange rectangle: "Pass@1"
* Teal rectangle: "Pass@k"
* **Data Series (Bars):**
* **Standard Run Type:**
* Pass@1 (Orange bar): Height corresponds to approximately 60.0%.
* Pass@k (Teal bar): Height corresponds to approximately 59.5%.
* **Energy-Aware Run Type:**
* Pass@1 (Orange bar): Height corresponds to approximately 60.0%.
* Pass@k (Teal bar): Height corresponds to approximately 70.0%.
**Text Box (Right Side):**
* **Location:** Positioned to the right of the bar chart, overlapping the x-axis area.
* **Content (Transcribed):**
```
Run Details:
Standard:
Samples: 20
Pass@1: 60.0%
Pass@k: 59.5%
Energy-Aware:
Samples: 20
Pass@1: 60.0%
Pass@k: 70.0%
```
### Detailed Analysis
**Scatter Plot Analysis:**
* **Trend Verification:** The plot shows two isolated data points, not a continuous trend line. The Standard Controller point is lower and to the left of the Energy-Aware Controller point.
* **Data Extraction:**
* Standard Controller: ~19.7 samples, 59.5% coverage.
* Energy-Aware Controller: ~20.3 samples, 70.0% coverage.
* **Spatial Grounding:** The legend is in the top-right. The blue circle (Standard) is in the lower-central region of the plot. The red square (Energy-Aware) is in the upper-central region, clearly higher on the y-axis.
**Bar Chart Analysis:**
* **Trend Verification:** For both controllers, the Pass@1 (orange) bars are of equal height. The Pass@k (teal) bar for the Standard Controller is slightly shorter than its Pass@1 bar, while the Pass@k bar for the Energy-Aware Controller is significantly taller than its Pass@1 bar.
* **Data Extraction (Approximate from visual):**
* Standard: Pass@1 ≈ 60.0%, Pass@k ≈ 59.5%.
* Energy-Aware: Pass@1 ≈ 60.0%, Pass@k ≈ 70.0%.
* **Cross-Reference:** The values annotated on the scatter plot (59.5% and 70.0%) match the Pass@k values shown in the bar chart and listed in the text box. The Pass@1 value of 60.0% for both is consistent across the bar chart and text box.
**Text Box Data:**
* Provides exact, non-approximate values that confirm the visual data from both charts. It states both runs used exactly 20 samples, clarifying the approximate x-axis positions in the scatter plot.
### Key Observations
1. **Identical Pass@1, Divergent Pass@k:** Both controllers achieve the same Pass@1 accuracy (60.0%). However, their Pass@k performance differs dramatically: 59.5% for Standard vs. 70.0% for Energy-Aware.
2. **Coverage vs. Samples:** The Energy-Aware Controller achieves significantly higher coverage (Pass@k) with a very similar number of samples (~20.3 vs. ~19.7) compared to the Standard Controller.
3. **Visual Discrepancy in Sample Count:** The text box states both runs used exactly 20 samples, but the scatter plot shows the data points at slightly different x-positions (~19.7 and ~20.3). This suggests the scatter plot may be using a jittered or approximate placement for visual clarity, or the "Number of Samples (N)" axis represents a different metric than the raw sample count listed in the details.
### Interpretation
The data suggests that the **Energy-Aware Controller provides a substantial improvement in overall coverage (Pass@k) without compromising the first-attempt accuracy (Pass@1)**. The fact that Pass@1 is identical indicates both systems are equally reliable on a single try. The key advantage of the Energy-Aware Controller is revealed when multiple attempts (k) are allowed, as it successfully covers 70.0% of cases compared to 59.5% for the Standard Controller.
This implies the Energy-Aware Controller's strategy—likely involving optimized resource allocation or smarter sampling—makes better use of its attempts. It doesn't just succeed more often on the first try (it doesn't), but it succeeds more often *within a budget of k attempts*. The scatter plot visually reinforces this by placing the Energy-Aware point in a superior position (higher coverage, similar sample count). The minor discrepancy in sample count visualization versus the stated value of 20 is a minor presentational artifact but does not affect the core conclusion about relative performance.