## Scatter Plot: Controller Performance Comparison
### Overview
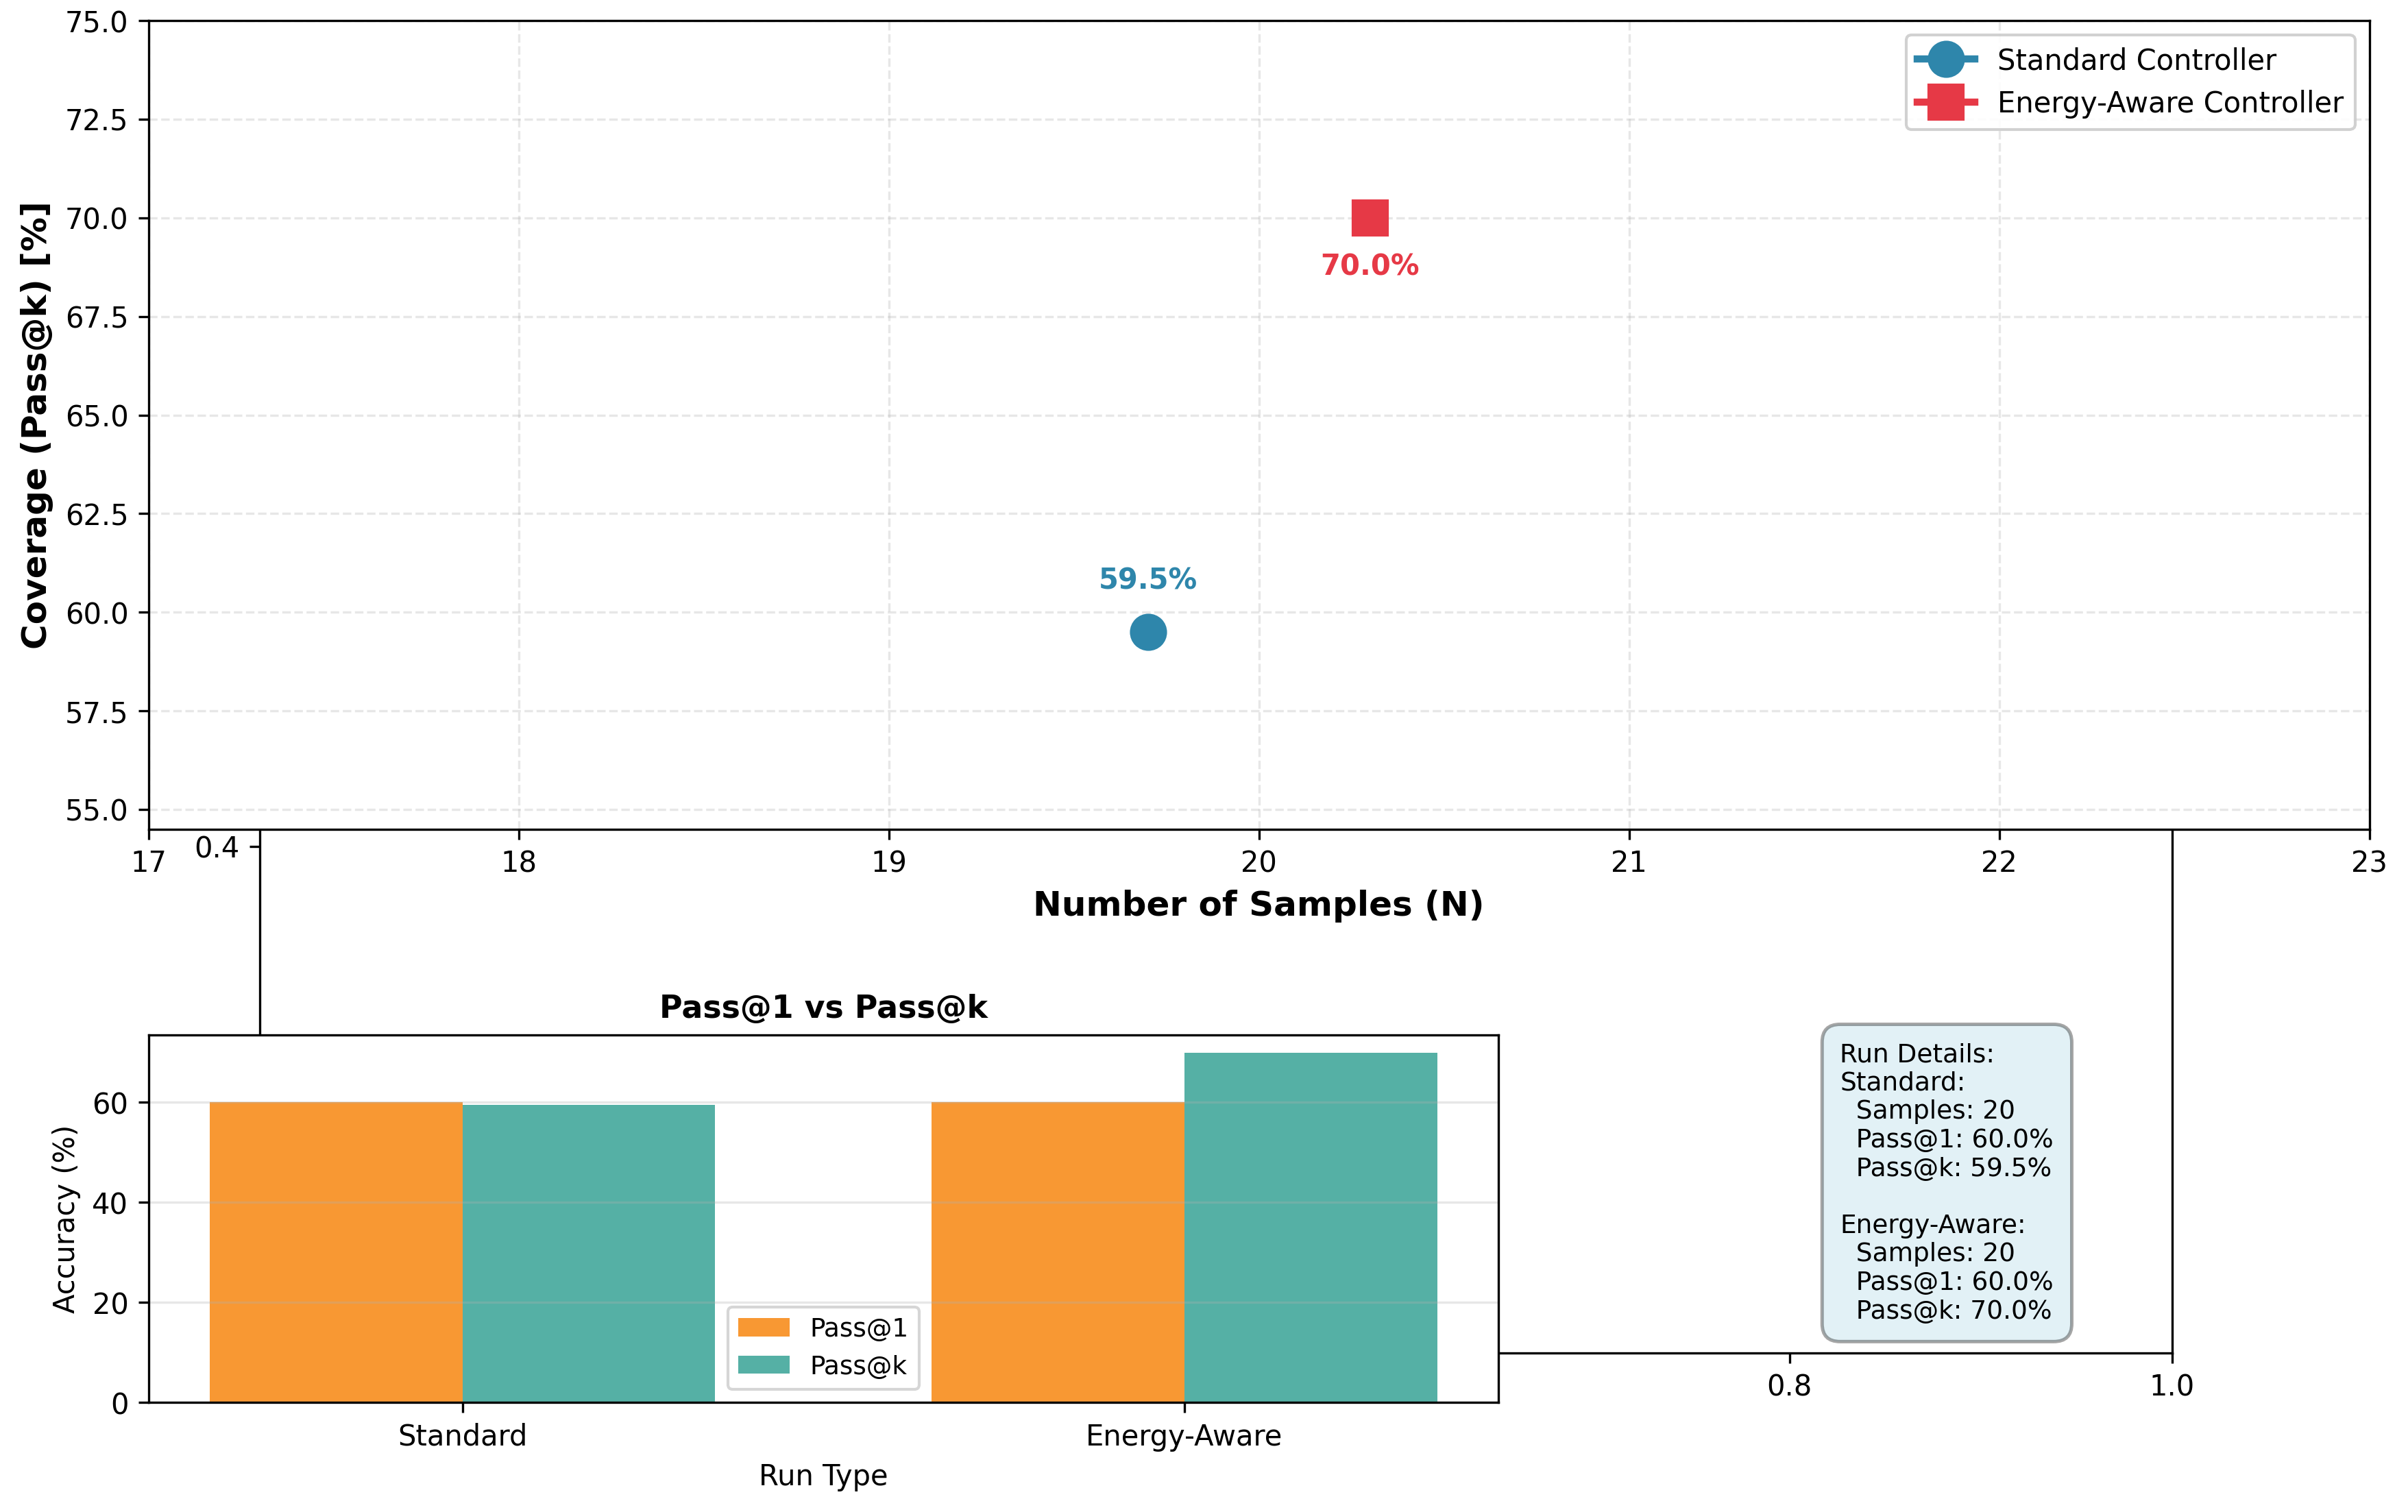
The image presents a comparative analysis of two controllers ("Standard Controller" and "Energy-Aware Controller") using a scatter plot and bar chart. The primary chart shows coverage metrics (Pass@k) against sample size (N), while the secondary bar chart compares Pass@1 and Pass@k accuracy.
### Components/Axes
1. **Main Chart**:
- **X-axis**: Number of Samples (N) [17-23]
- **Y-axis**: Coverage (Pass@k) [%]
- **Legend**:
- Blue circle: Standard Controller
- Red square: Energy-Aware Controller
- **Data Points**:
- Standard Controller: (20, 59.5%)
- Energy-Aware Controller: (20, 70.0%)
2. **Bar Chart**:
- **X-axis**: Run Type (Standard/Energy-Aware)
- **Y-axis**: Accuracy (%)
- **Bars**:
- Pass@1: 60% for both controllers
- Pass@k: 59.5% (Standard), 70% (Energy-Aware)
3. **Text Box**:
- Run Details:
- Standard: 20 samples, Pass@1=60%, Pass@k=59.5%
- Energy-Aware: 20 samples, Pass@1=60%, Pass@k=70%
### Detailed Analysis
- **Main Chart**:
- Both controllers tested at N=20 samples.
- Energy-Aware Controller achieves 70% Pass@k vs. 59.5% for Standard Controller.
- No other data points visible between N=17-23.
- **Bar Chart**:
- Pass@1 accuracy identical for both controllers (60%).
- Pass@k shows significant divergence: Energy-Aware Controller outperforms by 0.5%.
### Key Observations
1. Energy-Aware Controller demonstrates superior coverage (Pass@k) despite identical sample sizes.
2. Pass@1 accuracy is consistent across both controllers, suggesting similar initial performance.
3. The 0.5% difference in Pass@k represents a 0.85% relative improvement for Energy-Aware.
### Interpretation
The data suggests the Energy-Aware Controller maintains higher coverage efficiency at the same sample size, potentially indicating better resource optimization or algorithmic effectiveness. The identical Pass@1 performance implies both controllers handle initial data points equally well, but Energy-Aware demonstrates sustained performance across the full sample set. This could reflect architectural advantages in energy management or processing efficiency. The consistent Pass@1 metric across controllers suggests the comparison focuses on long-term performance rather than initial response.