## Chart: Best-of-8 Mean Acc vs Extracted ProcessBench Mean Acc
### Overview
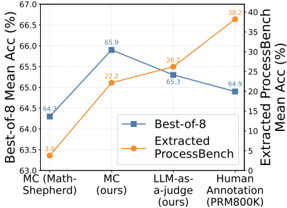
The image is a line chart comparing the "Best-of-8 Mean Acc (%)" and "Extracted ProcessBench Mean Acc (%)" across four different categories: "MC (Math-Shepherd)", "MC (ours)", "LLM-as-a-judge (ours)", and "Human Annotation (PRM800K)". The chart uses two different y-axes to represent the two different accuracy metrics.
### Components/Axes
* **X-axis:** Categories: "MC (Math-Shepherd)", "MC (ours)", "LLM-as-a-judge (ours)", "Human Annotation (PRM800K)".
* **Left Y-axis:** "Best-of-8 Mean Acc (%)", ranging from 63.0 to 67.0.
* **Right Y-axis:** "Extracted ProcessBench Mean Acc (%)", ranging from 0 to 40.
* **Legend:** Located in the center of the chart.
* Blue Square: "Best-of-8"
* Orange Circle: "Extracted ProcessBench"
### Detailed Analysis
* **Best-of-8 (Blue Line):**
* Trend: Initially increases, then decreases slightly, then decreases again.
* Data Points:
* MC (Math-Shepherd): 64.3%
* MC (ours): 65.9%
* LLM-as-a-judge (ours): 65.3%
* Human Annotation (PRM800K): 64.9%
* **Extracted ProcessBench (Orange Line):**
* Trend: Increases steadily.
* Data Points:
* MC (Math-Shepherd): 3.8%
* MC (ours): 22.2%
* LLM-as-a-judge (ours): 26.2%
* Human Annotation (PRM800K): 38.2%
### Key Observations
* The "Best-of-8" accuracy is highest for "MC (ours)" and "LLM-as-a-judge (ours)".
* The "Extracted ProcessBench" accuracy is highest for "Human Annotation (PRM800K)".
* The "Best-of-8" accuracy is generally higher than the "Extracted ProcessBench" accuracy for the first three categories, but the gap narrows for "Human Annotation (PRM800K)".
### Interpretation
The chart compares the performance of different methods ("MC (Math-Shepherd)", "MC (ours)", "LLM-as-a-judge (ours)", and "Human Annotation (PRM800K)") using two different accuracy metrics. The "Best-of-8" metric seems to represent a more traditional accuracy measure, while the "Extracted ProcessBench" metric might represent a more specific or challenging task. The results suggest that while the "Best-of-8" accuracy is relatively consistent across the different methods, the "Extracted ProcessBench" accuracy varies significantly, with "Human Annotation (PRM800K)" achieving the highest score. This could indicate that human annotation is particularly effective for the specific task measured by the "Extracted ProcessBench" metric. The "MC (ours)" and "LLM-as-a-judge (ours)" methods show a good balance between the two accuracy metrics.