\n
## Line Chart: Performance Comparison of Models on Math Reasoning Tasks
### Overview
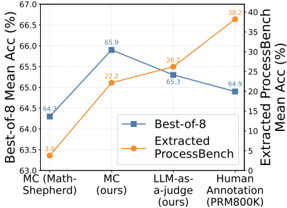
This line chart compares the performance of several models on math reasoning tasks, specifically focusing on "Best-of-8 Mean Accuracy" and "Extracted ProcessBench Mean Accuracy". The models evaluated are MC (Math-Shepherd), MC (ours), LLM-as-a-judge (ours), and Human Annotation (PRMB00K). The chart displays accuracy scores as a function of the model used.
### Components/Axes
* **X-axis:** Model Name (MC (Math-Shepherd), MC (ours), LLM-as-a-judge (ours), Human Annotation (PRMB00K)).
* **Y-axis (Left):** Best-of-8 Mean Accuracy (%). Scale ranges from approximately 63.0% to 67.0%.
* **Y-axis (Right):** Extracted ProcessBench Mean Accuracy (%). Scale ranges from approximately 0% to 40%.
* **Legend:**
* Blue Line: Best-of-8
* Orange Line: Extracted ProcessBench
* **Gridlines:** Horizontal gridlines are present to aid in reading the values.
### Detailed Analysis
* **MC (Math-Shepherd):**
* Best-of-8 Accuracy: Approximately 64.3%.
* Extracted ProcessBench Accuracy: Approximately 3.8%.
* **MC (ours):**
* Best-of-8 Accuracy: Approximately 65.9%. This represents the peak accuracy for the "Best-of-8" line.
* Extracted ProcessBench Accuracy: Approximately 22.2%.
* **LLM-as-a-judge (ours):**
* Best-of-8 Accuracy: Approximately 65.3%.
* Extracted ProcessBench Accuracy: Approximately 26.2%.
* **Human Annotation (PRMB00K):**
* Best-of-8 Accuracy: Approximately 64.9%.
* Extracted ProcessBench Accuracy: Approximately 38.2%.
**Trend Analysis:**
* **Best-of-8 (Blue Line):** The line initially slopes upward from MC (Math-Shepherd) to MC (ours), reaching a peak, then slopes downward towards Human Annotation.
* **Extracted ProcessBench (Orange Line):** The line consistently slopes upward from MC (Math-Shepherd) to Human Annotation, indicating increasing accuracy.
### Key Observations
* The "MC (ours)" model achieves the highest "Best-of-8" accuracy.
* Human Annotation achieves the highest "Extracted ProcessBench" accuracy.
* There is a clear trade-off between the two accuracy metrics. Models with higher "Best-of-8" accuracy don't necessarily have higher "Extracted ProcessBench" accuracy, and vice-versa.
* The "Extracted ProcessBench" accuracy is significantly lower than the "Best-of-8" accuracy for all models.
### Interpretation
The chart demonstrates a comparison of different models' performance on math reasoning tasks, assessed through two different metrics: "Best-of-8" accuracy and "Extracted ProcessBench" accuracy. "Best-of-8" likely represents a standard accuracy measure, while "Extracted ProcessBench" assesses the accuracy of the *process* or reasoning steps extracted from the models.
The fact that "MC (ours)" performs best on "Best-of-8" suggests it's good at arriving at the correct answer, but the lower "Extracted ProcessBench" score indicates that the reasoning steps it takes to get there might not be as accurate or interpretable. Conversely, Human Annotation excels at "Extracted ProcessBench," suggesting humans are better at providing accurate and understandable reasoning steps, even if their overall accuracy ("Best-of-8") is slightly lower than "MC (ours)".
The diverging trends of the two lines suggest that optimizing for one metric may come at the expense of the other. This highlights the importance of considering both answer accuracy and reasoning quality when evaluating math reasoning models. The large difference in scale between the two Y-axes also suggests that the "Extracted ProcessBench" metric is more sensitive to variations in performance.