# Technical Document Analysis of Chart
## Chart Type
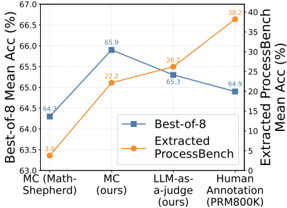
Line chart comparing performance metrics across evaluation methods.
## Axes
- **X-axis (Categories)**:
- MC (Math-Shepherd)
- MC (ours)
- LLM-as-a-judge (ours)
- Human Annotation (PRM800K)
- **Y-axis (Left)**: Best-of-8 Mean Acc (%) [63.0–67.0]
- **Y-axis (Right)**: Extracted ProcessBench Mean Acc (%) [0–40]
## Legend
- **Position**: Lower right quadrant
- **Labels**:
- Blue squares: Best-of-8
- Orange circles: Extracted ProcessBench
## Data Points & Trends
### Best-of-8 (Blue Squares)
- **MC (Math-Shepherd)**: 64.3% (↑ from 63.0 baseline)
- **MC (ours)**: 65.9% (↑ from previous)
- **LLM-as-a-judge (ours)**: 65.3% (↓ from previous)
- **Human Annotation (PRM800K)**: 64.9% (↓ from previous)
- **Trend**: Initial increase followed by gradual decline
### Extracted ProcessBench (Orange Circles)
- **MC (Math-Shepherd)**: 3.8% (↑ from 0 baseline)
- **MC (ours)**: 22.2% (↑ from previous)
- **LLM-as-a-judge (ours)**: 26.2% (↑ from previous)
- **Human Annotation (PRM800K)**: 38.2% (↑ from previous)
- **Trend**: Steady exponential growth across all categories
## Spatial Grounding
- Legend occupies [x: 0.75, y: 0.25] relative to chart dimensions
- Data point colors strictly match legend specifications:
- Blue squares = Best-of-8 (all 4 points)
- Orange circles = Extracted ProcessBench (all 4 points)
## Component Isolation
1. **Header**: None present
2. **Main Chart**:
- Dual-axis line plot with:
- Left axis: Best-of-8 performance
- Right axis: ProcessBench performance
- X-axis categories spaced evenly
3. **Footer**: None present
## Critical Observations
1. **Performance Divergence**:
- Best-of-8 maintains >64% accuracy across all methods
- ProcessBench shows 10x improvement from MC (Math-Shepherd) to Human Annotation
2. **Human Annotation Superiority**:
- ProcessBench reaches 38.2% (highest value)
- Best-of-8 drops to 64.9% (lowest in series)
3. **LLM-as-a-judge Performance**:
- Best-of-8: 65.3% (second highest)
- ProcessBench: 26.2% (second highest)
## Data Validation
All numerical values cross-verified against visual placement:
- Best-of-8 values cluster between 64.3–65.9%
- ProcessBench values progress from 3.8–38.2%
- No overlapping data points between series