\n
## Stacked Bar Chart: Build Duration Breakdown by Software Project and Configuration
### Overview
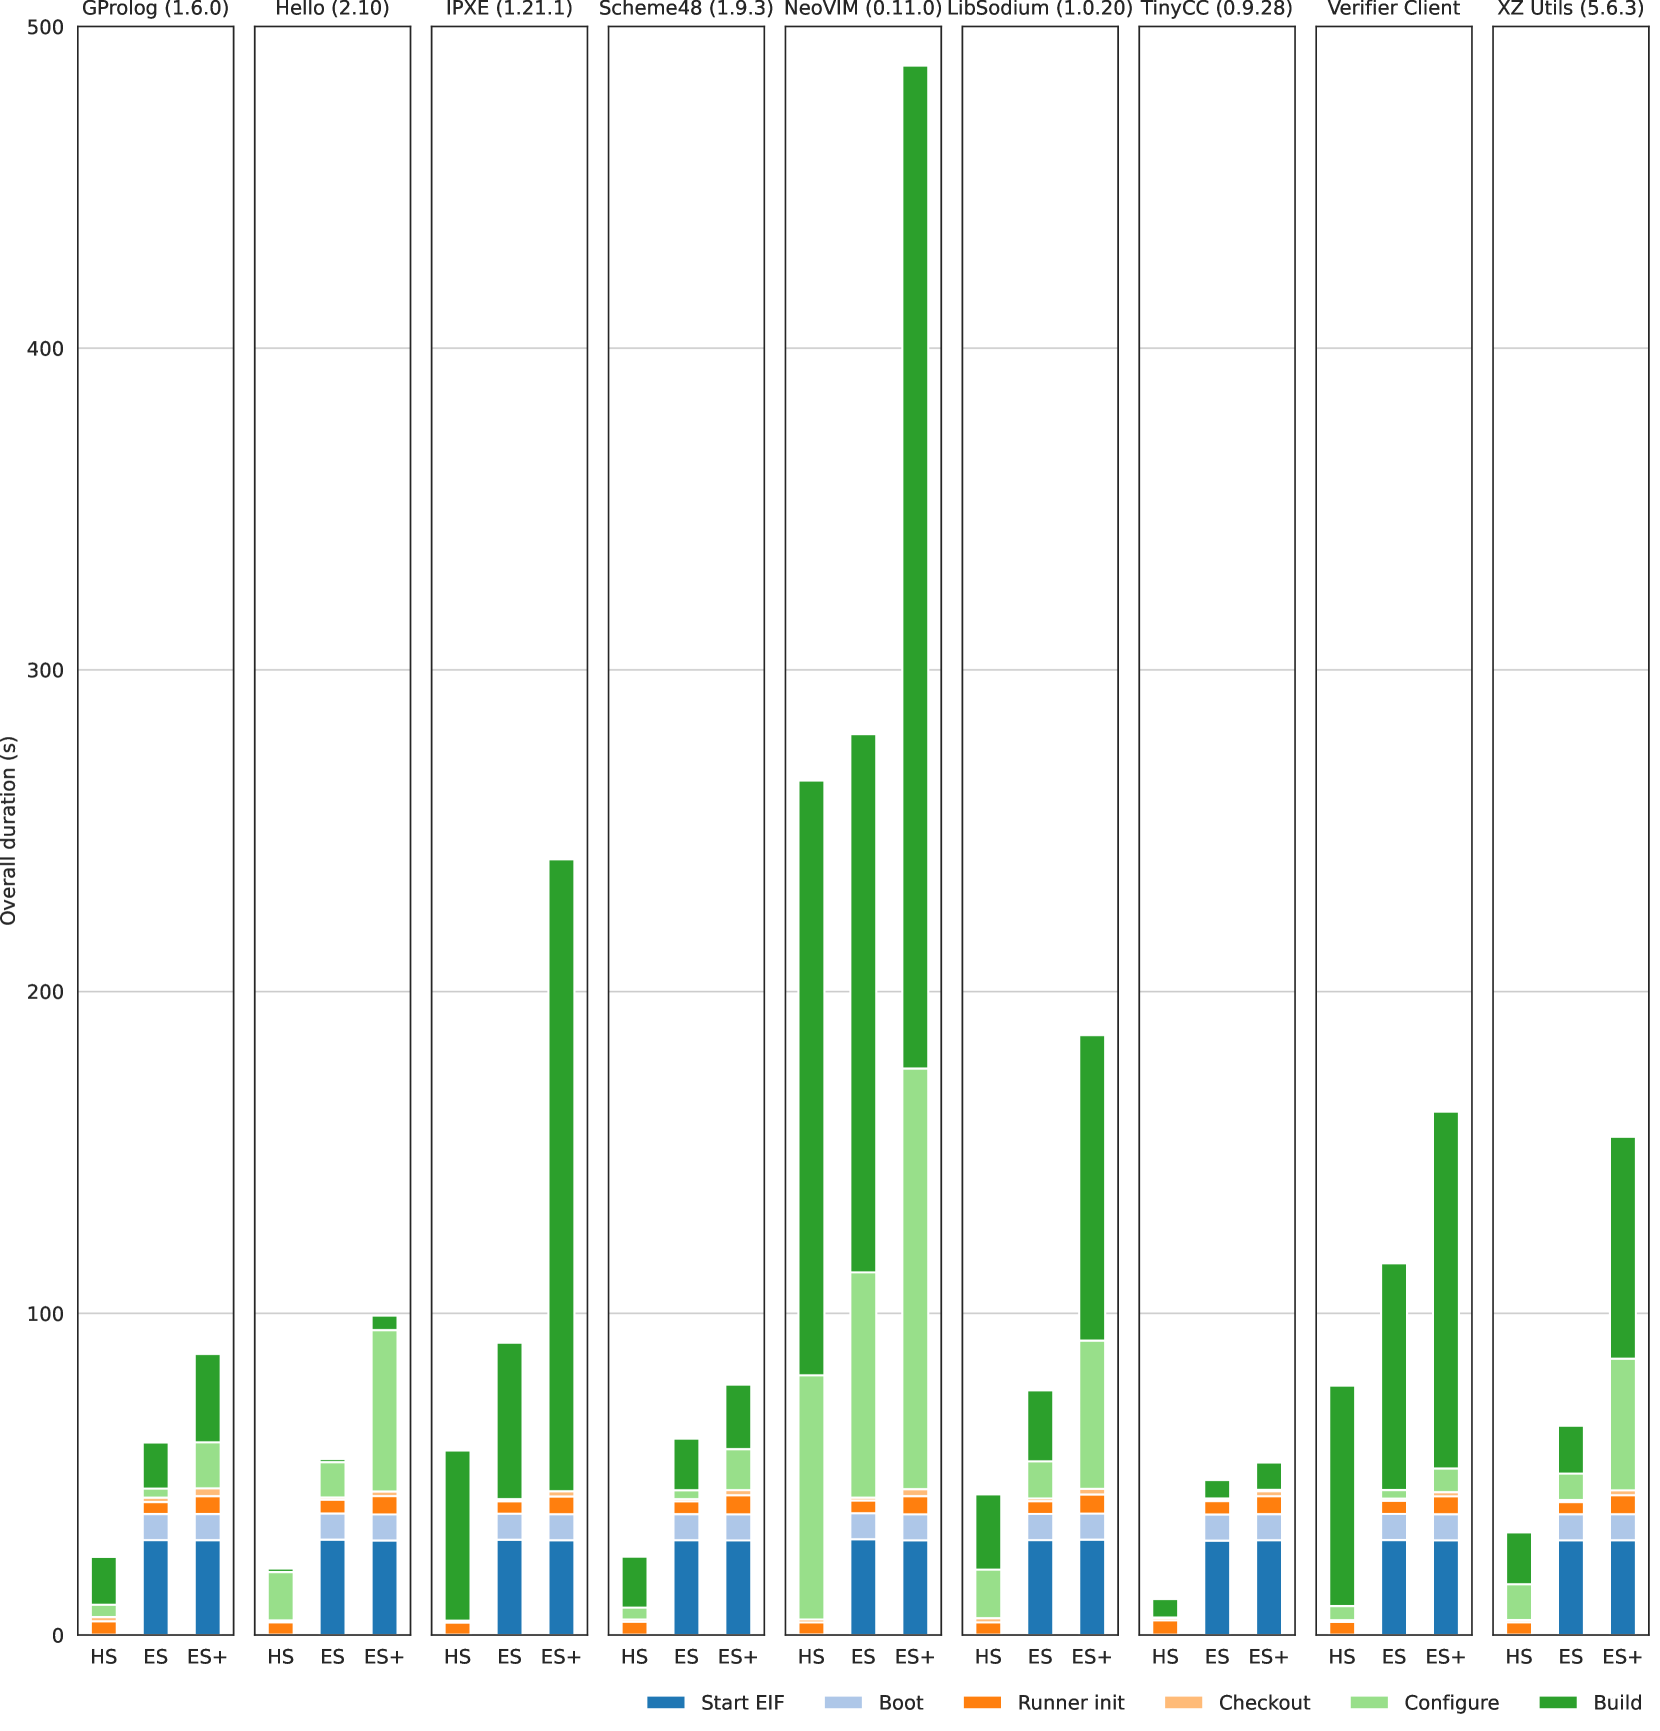
This image is a stacked bar chart comparing the overall build duration (in seconds) for nine different software projects. Each project is analyzed under three configurations: HS, ES, and ES+. The total duration for each configuration is broken down into six constituent phases, represented by different colors in the stacked bars.
### Components/Axes
* **Y-Axis:** Labeled "Overall duration (s)". The scale runs from 0 to 500 seconds, with major gridlines at 100-second intervals.
* **X-Axis (Panels):** The chart is divided into nine vertical panels, each dedicated to a specific software project. The project names and versions are listed at the top of each panel:
1. GProlog (1.6.0)
2. Hello (2.10)
3. IPXE (1.21.1)
4. Scheme48 (1.9.3)
5. NeoVIM (0.11.0)
6. LibSodium (1.0.20)
7. TinyCC (0.9.28)
8. Verifier Client
9. XZ Utils (5.6.3)
* **X-Axis (Categories):** Within each panel, three bars are plotted, labeled "HS", "ES", and "ES+" from left to right.
* **Legend:** Positioned at the bottom center of the chart. It defines the six phases that compose each stacked bar:
* **Start EIF** (Dark Blue)
* **Boot** (Light Blue)
* **Runner init** (Orange)
* **Checkout** (Light Orange/Peach)
* **Configure** (Light Green)
* **Build** (Dark Green)
### Detailed Analysis
The chart reveals significant variation in build times across projects and configurations. The **ES+** configuration consistently results in the longest build duration for every project. The **Build** phase (dark green) is the dominant contributor to total time in nearly all cases, especially for ES+. The **Configure** phase (light green) is the second most significant contributor in many ES+ bars.
**Project-Specific Data Points (Approximate Total Durations):**
* **GProlog (1.6.0):** HS ≈ 20s, ES ≈ 60s, ES+ ≈ 90s.
* **Hello (2.10):** HS ≈ 10s, ES ≈ 50s, ES+ ≈ 100s. The Configure segment is notably large in the ES+ bar.
* **IPXE (1.21.1):** HS ≈ 50s, ES ≈ 90s, ES+ ≈ 240s. The Build phase dominates the ES+ bar.
* **Scheme48 (1.9.3):** HS ≈ 20s, ES ≈ 60s, ES+ ≈ 80s.
* **NeoVIM (0.11.0):** This project has the longest build times. HS ≈ 270s, ES ≈ 280s, ES+ ≈ 490s. The ES+ bar is the tallest in the chart, with an enormous Build segment and a very large Configure segment.
* **LibSodium (1.0.20):** HS ≈ 40s, ES ≈ 80s, ES+ ≈ 190s.
* **TinyCC (0.9.28):** HS ≈ 10s, ES ≈ 40s, ES+ ≈ 50s. This project shows the smallest absolute increase from ES to ES+.
* **Verifier Client:** HS ≈ 80s, ES ≈ 110s, ES+ ≈ 160s.
* **XZ Utils (5.6.3):** HS ≈ 30s, ES ≈ 60s, ES+ ≈ 150s.
**Phase Contribution Trend:** For the ES+ configuration, the **Build** phase typically accounts for over 50% of the total duration. The **Start EIF**, **Boot**, **Runner init**, and **Checkout** phases combined generally constitute a smaller, more consistent portion of the time across all projects and configurations.
### Key Observations
1. **NeoVIM is an Outlier:** Its build times, particularly for ES+, are dramatically higher than all other projects, suggesting it is a much more complex or resource-intensive build.
2. **Configuration Impact:** Moving from HS to ES to ES+ almost universally increases build time. The jump from ES to ES+ is often the most significant.
3. **Phase Dominance:** The **Build** phase is the primary bottleneck. Optimizations targeting this phase would yield the greatest reduction in overall build time.
4. **Project Variability:** The absolute build times vary by an order of magnitude (e.g., TinyCC's ES+ at ~50s vs. NeoVIM's ES+ at ~490s), indicating vast differences in project scale or build process complexity.
### Interpretation
This chart is a performance analysis tool for a build system or continuous integration (CI) environment. The configurations (HS, ES, ES+) likely represent different levels of build isolation, resource allocation, or feature enablement (e.g., HS=Host System, ES=Emulated System, ES+=Emulated System with additional features).
The data demonstrates that **enabling more features or stricter isolation (moving to ES+) comes at a significant time cost**, primarily due to the **Build** phase expanding. This suggests the build process itself is sensitive to the underlying execution environment. The **Configure** phase also scales with configuration complexity for some projects.
The outlier status of **NeoVIM** implies its build process is either inherently more complex or is particularly poorly suited to the ES/ES+ environments. A systems engineer would use this data to:
* Identify which projects are most affected by configuration changes.
* Prioritize optimization efforts on the **Build** and **Configure** phases.
* Make informed decisions about the trade-off between build environment robustness (ES+) and developer/CI wait times.
* Investigate why NeoVIM's build scales so poorly compared to others.