## Bar Chart: Overall Duration (s) of Software Tools Across Environments
### Overview
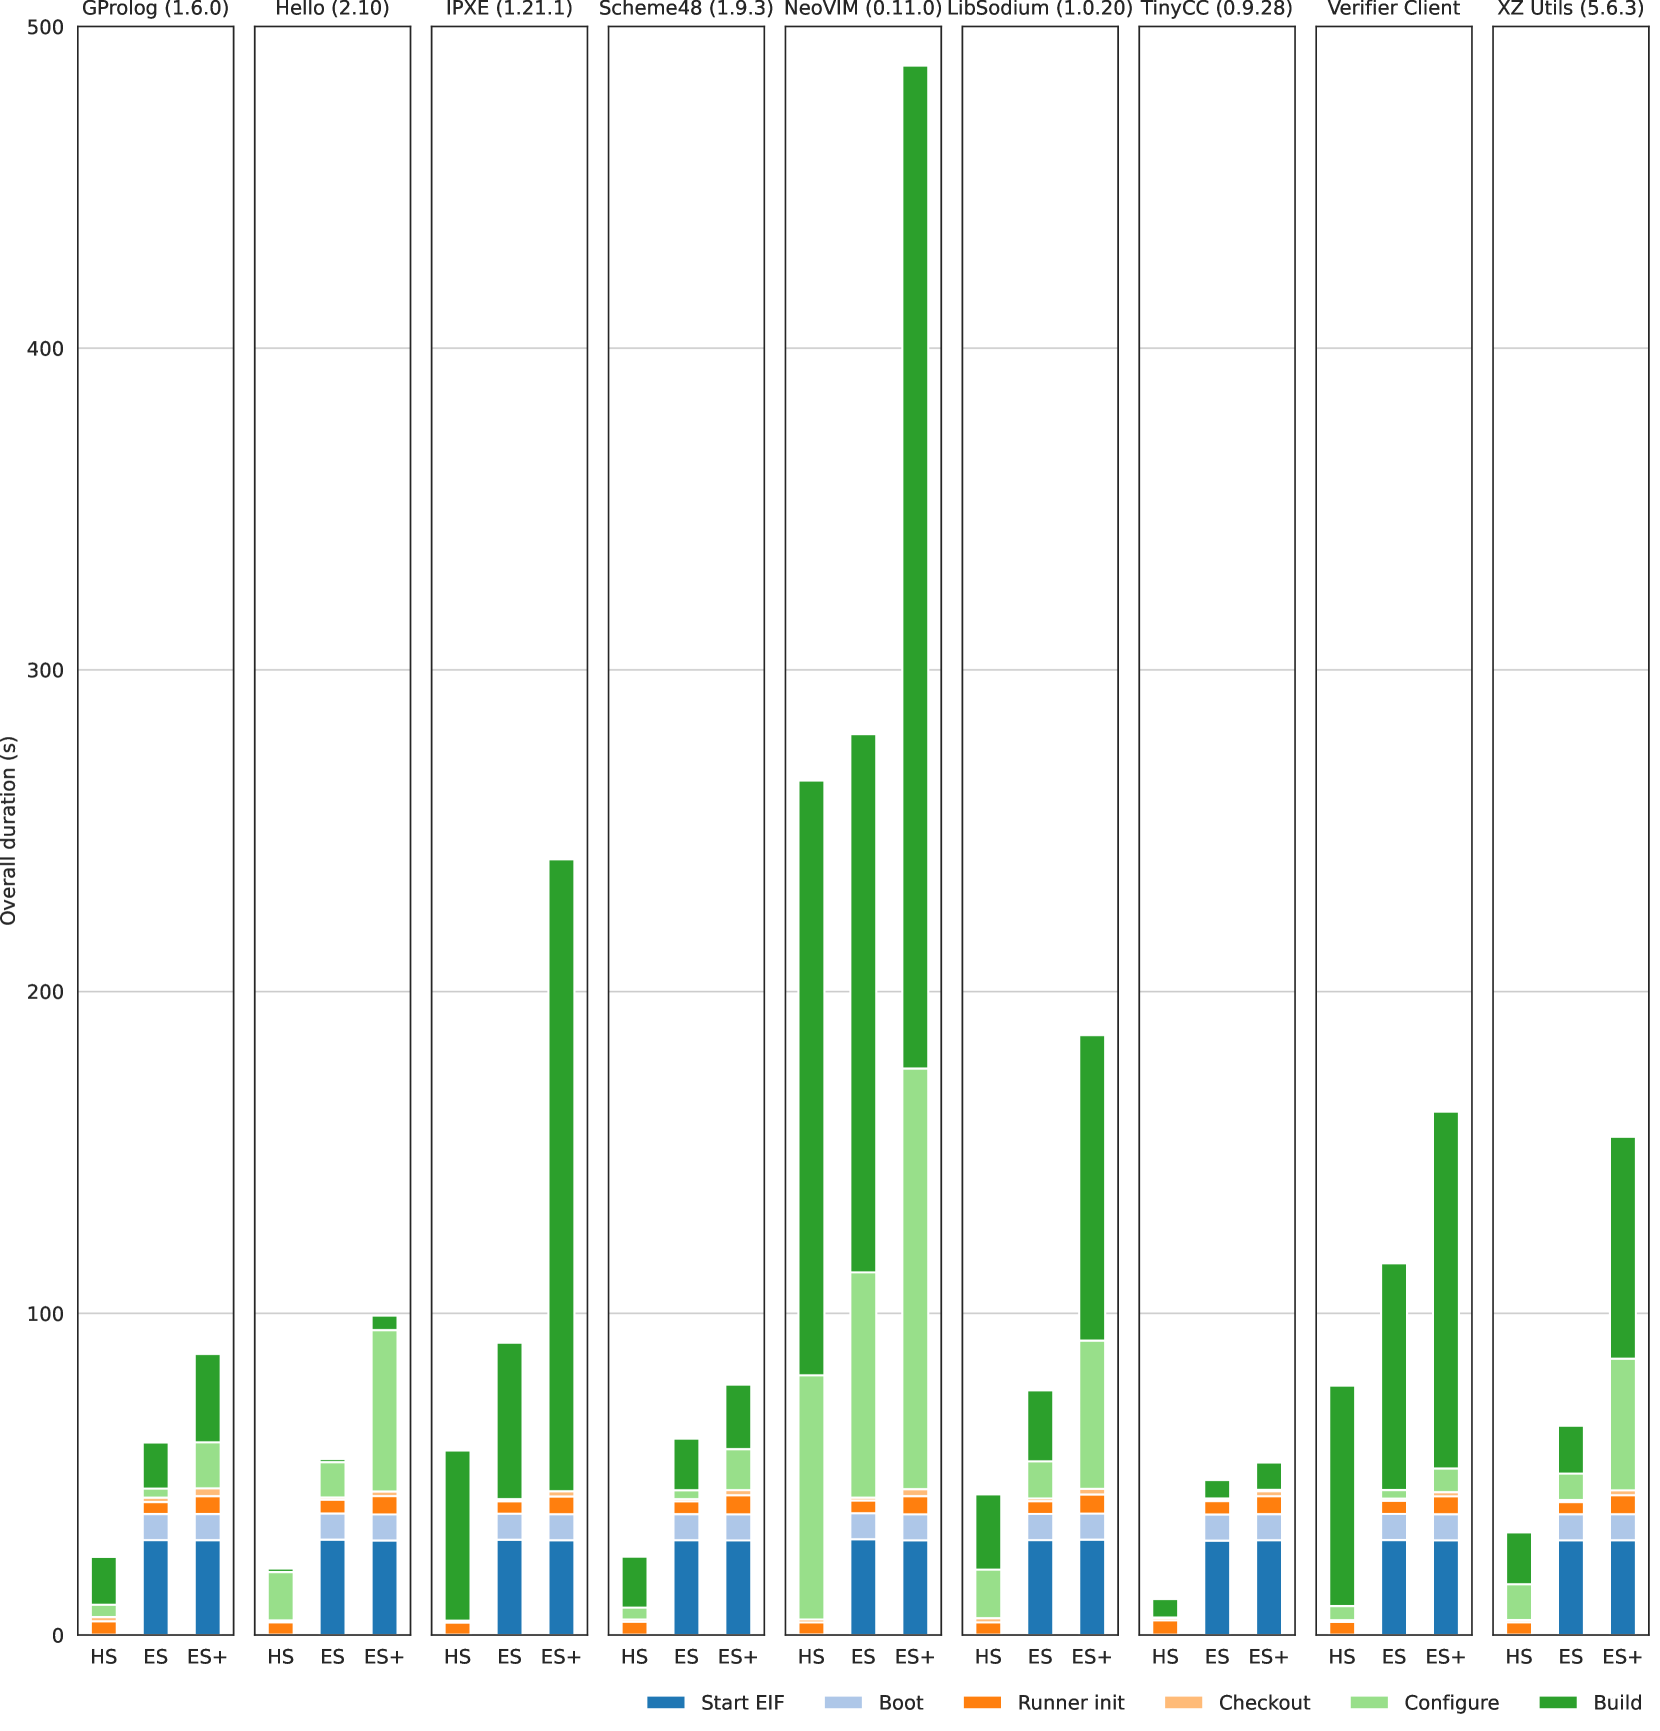
The chart is a grouped bar chart comparing the **overall duration (in seconds)** of various software tools across three environments: **HS**, **ES**, and **ES+**. Each tool has three bars (one per environment), with colors corresponding to a legend that maps colors to specific components (e.g., Start EIF, Boot, etc.). The y-axis ranges from 0 to 500 seconds, and the x-axis lists software tools with their version numbers.
---
### Components/Axes
- **X-axis**: Software tools (e.g., GProlog, Hello, IPXE, etc.) with version numbers in parentheses.
- **Y-axis**: "Overall duration (s)" with a scale from 0 to 500.
- **Legend**: Located at the bottom, mapping colors to components:
- **Blue**: Start EIF
- **Light Blue**: Boot
- **Orange**: Runner init
- **Light Orange**: Checkout
- **Green**: Configure
- **Dark Green**: Build
---
### Detailed Analysis
#### Key Data Points and Trends
1. **NeoVIM (0.11.0)**:
- **ES+**: Tallest bar (~490s), indicating the longest overall duration.
- **ES**: ~280s.
- **HS**: ~120s.
- **Trend**: Duration increases significantly with environment complexity (HS < ES < ES+).
2. **LibSodium (1.0.20)**:
- **ES+**: ~380s (second-tallest).
- **ES**: ~180s.
- **HS**: ~60s.
- **Trend**: Similar to NeoVIM, with a steep increase in ES+.
3. **IPXE (1.21.1)**:
- **HS**: Shortest bar (~30s).
- **ES**: ~50s.
- **ES+**: ~70s.
- **Trend**: Minimal variation across environments.
4. **Other Tools**:
- **GProlog (1.6.0)**: ~80s (HS), ~120s (ES), ~150s (ES+).
- **Hello (2.10)**: ~90s (HS), ~130s (ES), ~160s (ES+).
- **Scheme48 (1.9.3)**: ~70s (HS), ~110s (ES), ~140s (ES+).
- **TinyCC (0.9.28)**: ~40s (HS), ~60s (ES), ~80s (ES+).
- **Verifier Client**: ~100s (HS), ~140s (ES), ~170s (ES+).
- **XZ Utils (5.6.3)**: ~50s (HS), ~80s (ES), ~110s (ES+).
#### Color Mapping and Legend
- **HS**: Blue (Start EIF)
- **ES**: Light Blue (Boot)
- **ES+**: Orange (Runner init)
- **Note**: The legend’s colors (e.g., green for Configure) do not directly map to the environment bars, suggesting the chart may represent **total duration** rather than component breakdowns.
---
### Key Observations
1. **Environmental Impact**:
- **ES+** consistently shows the longest durations, likely due to increased complexity or resource usage.
- **HS** (simplest environment) has the shortest durations for most tools.
2. **Outliers**:
- **NeoVIM** in **ES+** is the slowest tool (~490s), far exceeding others.
- **IPXE** in **HS** is the fastest (~30s), significantly lower than other tools.
3. **Color Consistency**:
- The legend’s colors (e.g., green for Configure) do not align with the environment bars, indicating a potential mismatch or mislabeling.
---
### Interpretation
The chart highlights how **environment complexity** (HS < ES < ES+) correlates with **execution time** for software tools. Tools like **NeoVIM** and **LibSodium** are particularly sensitive to environment changes, while **IPXE** remains efficient across all environments. The legend’s color mapping appears inconsistent with the chart’s data, suggesting a possible error in labeling or a misinterpretation of the chart’s purpose. This discrepancy could lead to confusion in analyzing component-specific durations (e.g., Start EIF vs. Build).
The data underscores the importance of environment optimization for performance-critical tools, with **ES+** requiring further investigation to address inefficiencies.