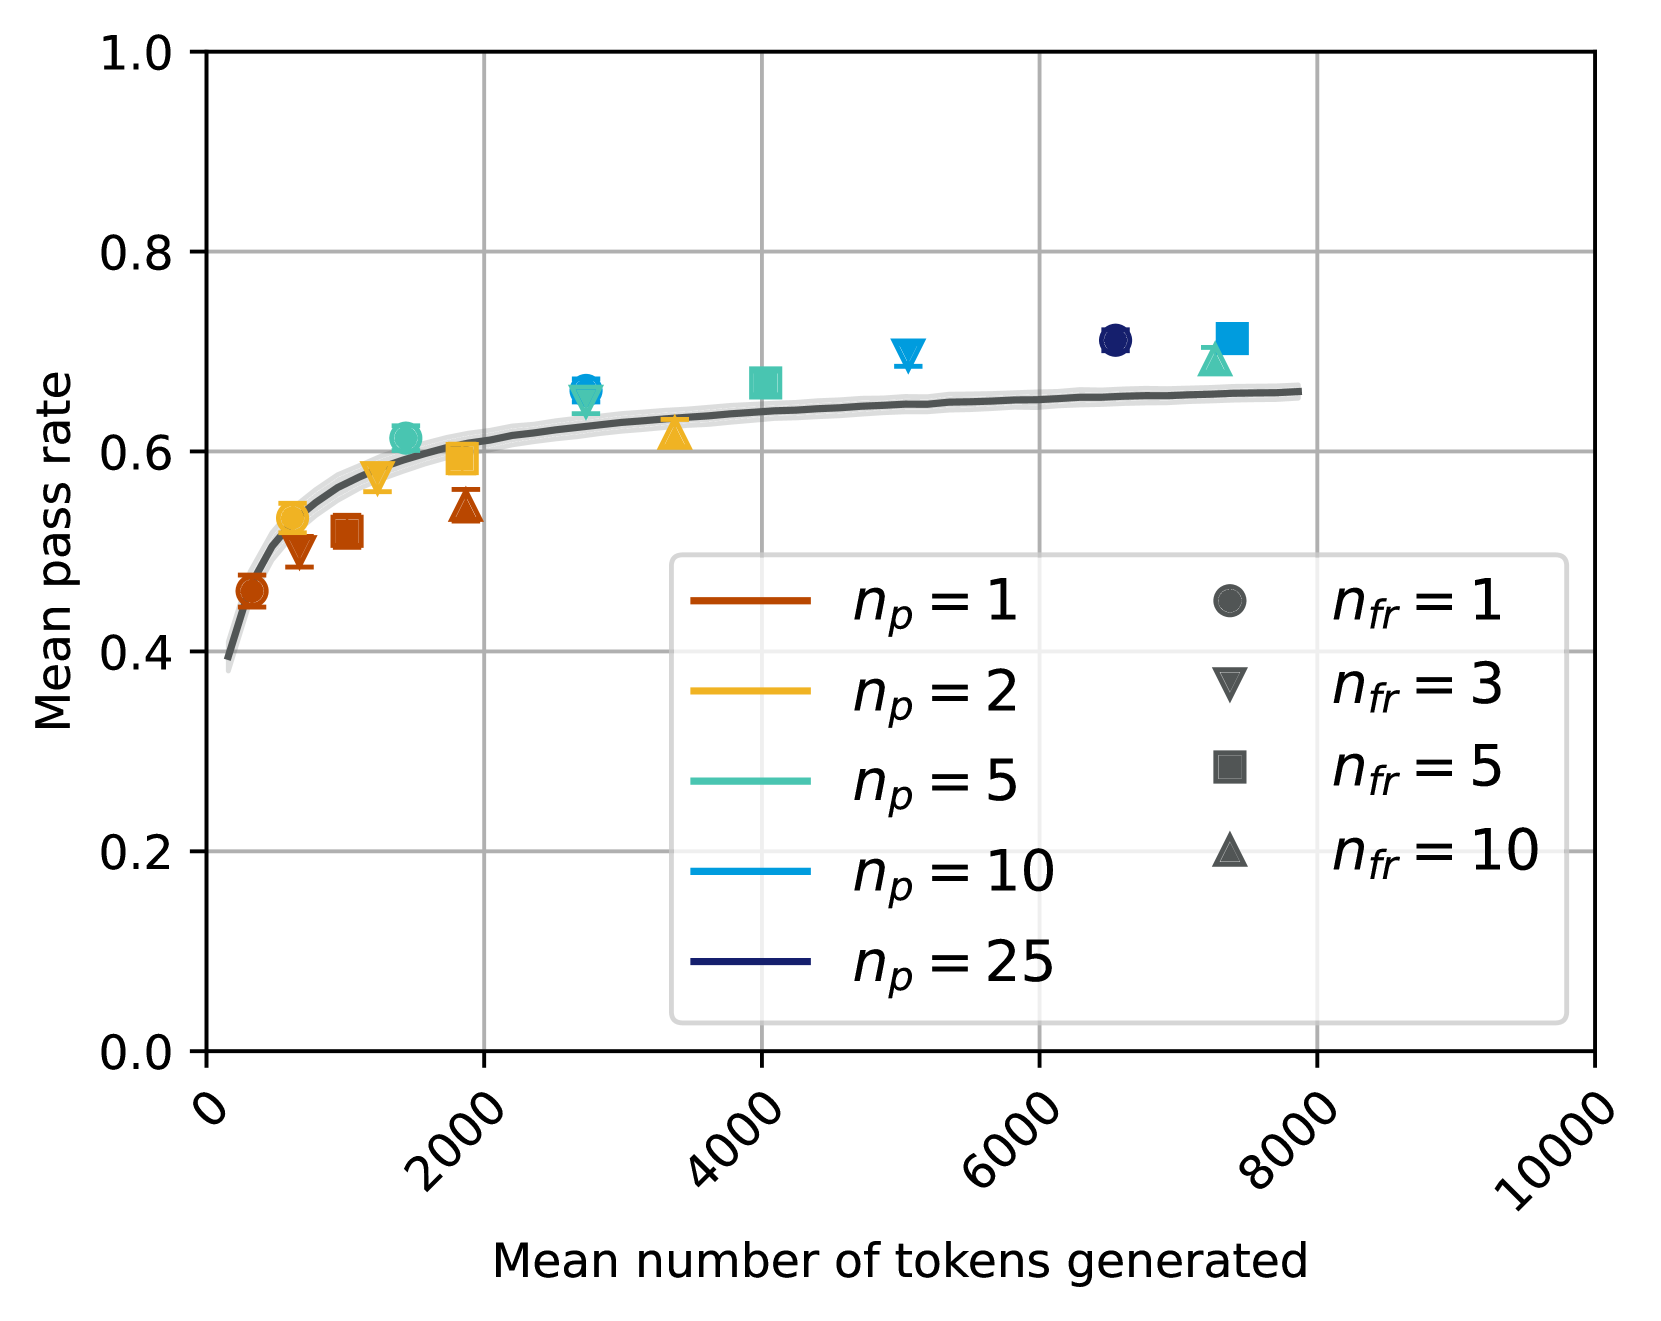
## Line Graph: Relationship Between Token Generation and Mean Pass Rate
### Overview
The image depicts a line graph with a shaded confidence interval, plotting the relationship between the mean number of tokens generated (x-axis) and the mean pass rate (y-axis). Data points in various colors and shapes represent different parameter configurations (np and nfr values). The graph shows a general upward trend in pass rate with increasing token generation, followed by a plateau.
### Components/Axes
- **X-axis**: "Mean number of tokens generated" (0 to 10,000, linear scale)
- **Y-axis**: "Mean pass rate" (0.0 to 1.0, linear scale)
- **Legend**: Located in the bottom-right corner, mapping colors/shapes to parameters:
- **np values** (number of parameters):
- np=1 (red line)
- np=2 (orange line)
- np=5 (teal line)
- np=10 (blue line)
- np=25 (dark blue line)
- **nfr values** (number of function rules):
- nfr=1 (red circle)
- nfr=3 (orange triangle)
- nfr=5 (teal square)
- nfr=10 (blue triangle)
### Detailed Analysis
1. **Main Line (Black)**:
- Starts at ~0.4 (y-axis) when x=0.
- Rises steeply to ~0.65 at x=8,000.
- Plateaus at ~0.65–0.70 beyond x=8,000.
- Shaded area (confidence interval) widens at lower x-values (e.g., 0.55–0.75 at x=8,000) and narrows as x increases.
2. **Data Series**:
- **np=1 (Red Line)**:
- Data points: (1,000, 0.45), (2,000, 0.55), (4,000, 0.60), (6,000, 0.63), (8,000, 0.65).
- **np=2 (Orange Line)**:
- Data points: (1,000, 0.50), (2,000, 0.58), (4,000, 0.62), (6,000, 0.65), (8,000, 0.67).
- **np=5 (Teal Line)**:
- Data points: (2,000, 0.60), (4,000, 0.65), (6,000, 0.68), (8,000, 0.70).
- **np=10 (Blue Line)**:
- Data points: (4,000, 0.65), (6,000, 0.70), (8,000, 0.72).
- **np=25 (Dark Blue Line)**:
- Data points: (6,000, 0.70), (8,000, 0.72).
- **nfr Values**:
- nfr=1 (Red Circles): (1,000, 0.45), (2,000, 0.55), (4,000, 0.60).
- nfr=3 (Orange Triangles): (2,000, 0.58), (4,000, 0.62), (6,000, 0.65).
- nfr=5 (Teal Squares): (4,000, 0.65), (6,000, 0.68), (8,000, 0.70).
- nfr=10 (Blue Triangles): (6,000, 0.70), (8,000, 0.72).
### Key Observations
- **Trend**: Pass rate increases with token generation, but the rate of improvement slows after ~8,000 tokens.
- **np Impact**: Higher np values achieve higher pass rates (e.g., np=25 reaches 0.72 vs. np=1 at 0.65).
- **nfr Impact**: Higher nfr values correlate with higher pass rates for the same np (e.g., nfr=10 at 0.72 vs. nfr=1 at 0.45 for np=1).
- **Confidence Interval**: The shaded area suggests greater uncertainty in pass rate estimates at lower token counts.
### Interpretation
The data demonstrates a clear positive correlation between token generation and mean pass rate, with diminishing returns at higher token counts. Increasing np (model complexity) and nfr (rule diversity) both improve performance, but np has a more pronounced effect. The confidence interval narrowing at higher token counts indicates more reliable estimates as data volume grows. The plateau at ~0.7 suggests a performance ceiling under the tested conditions. The overlap between np and nfr data points implies that both parameters contribute synergistically to the outcome, though np appears to dominate.