\n
## Line Chart: Mean Pass Rate vs. Mean Number of Tokens Generated
### Overview
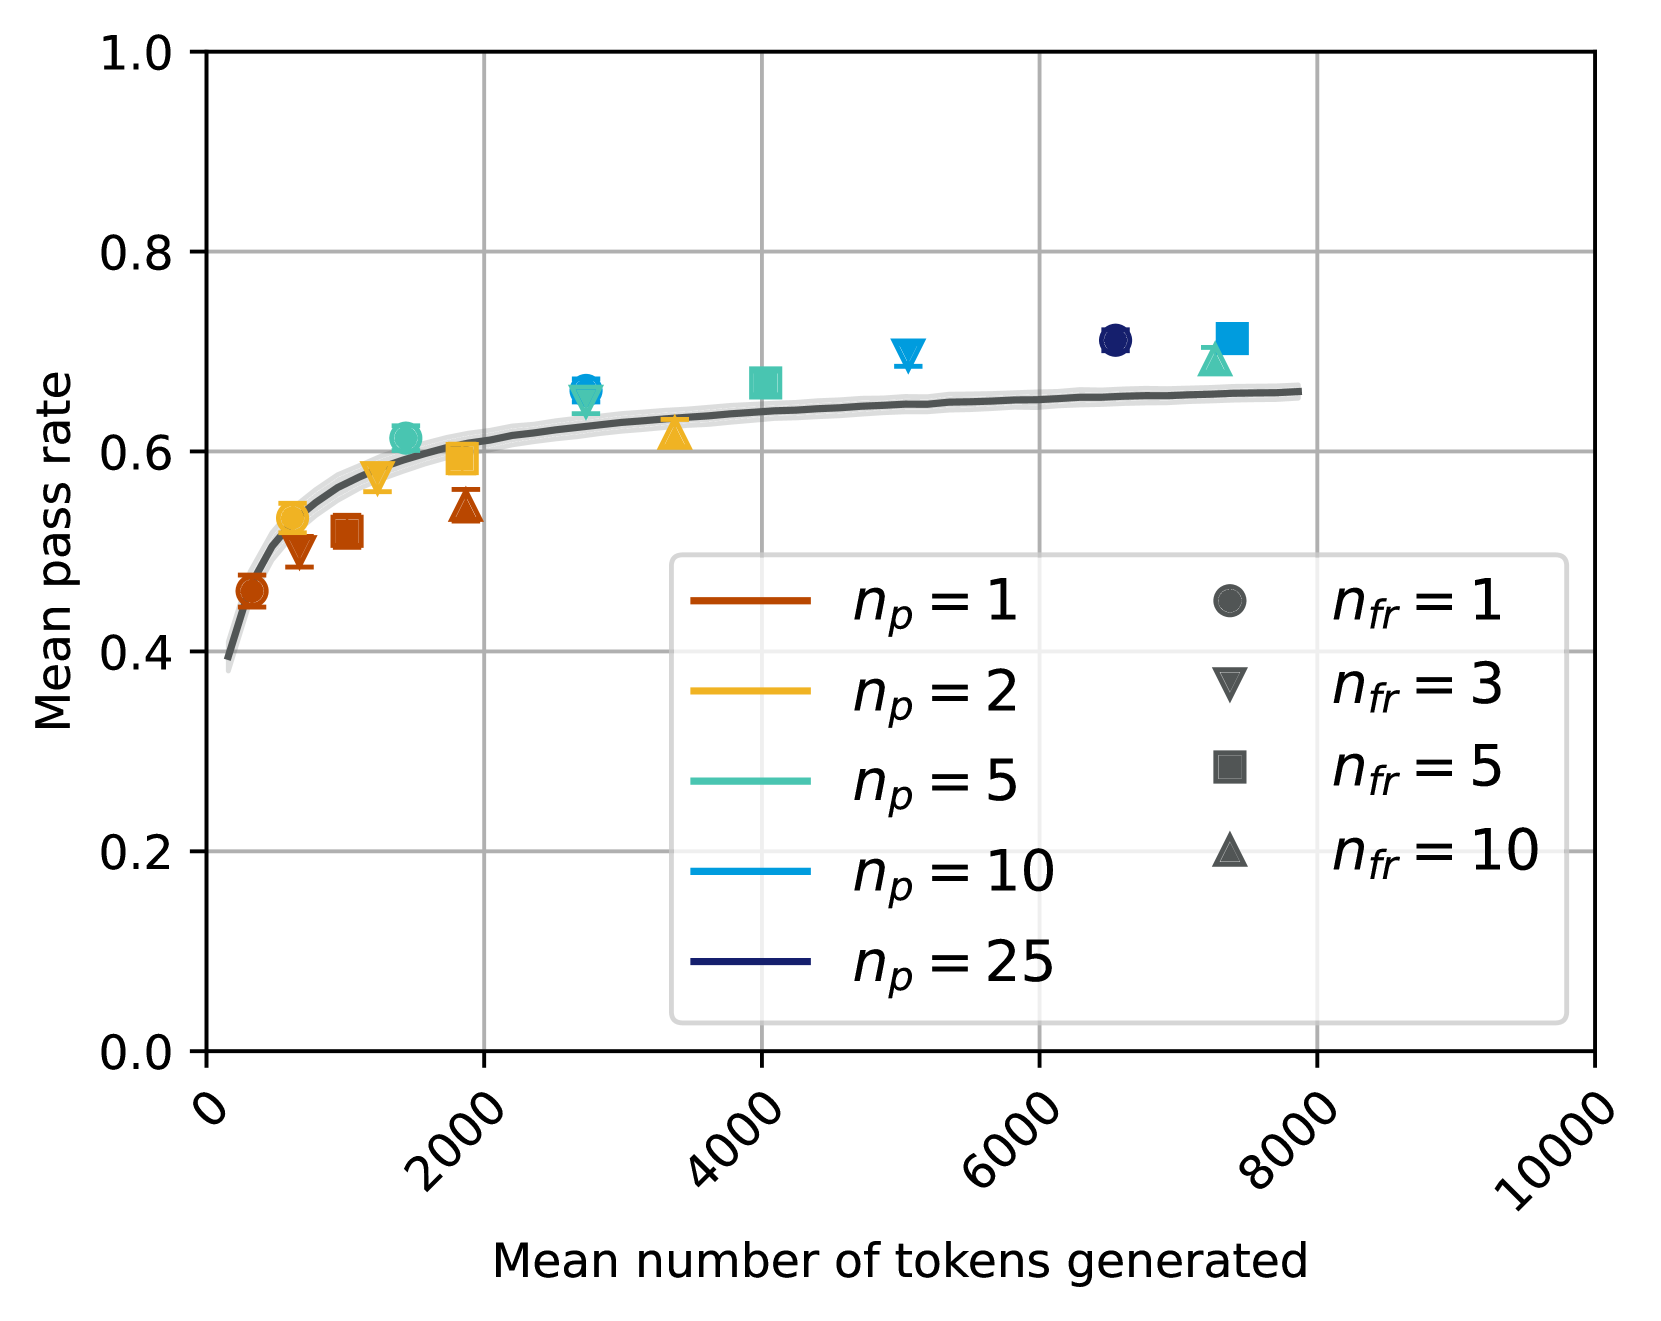
This chart displays the relationship between the mean pass rate and the mean number of tokens generated, with different lines representing different values of *n<sub>p</sub>* (presumably a parameter related to prompt engineering or model configuration). Data points are overlaid on the lines, differentiated by *n<sub>fr</sub>* values. The chart aims to show how the pass rate changes as the number of tokens generated increases, for various parameter settings.
### Components/Axes
* **X-axis:** Mean number of tokens generated (Scale: 0 to 10000, approximately).
* **Y-axis:** Mean pass rate (Scale: 0.0 to 1.0, approximately).
* **Lines:** Represent different values of *n<sub>p</sub>*: 1, 2, 5, 10, and 25.
* **Markers:** Represent different values of *n<sub>fr</sub>*: 1, 3, 5, and 10.
* **Legend (bottom-right):** Clearly identifies the color and corresponding *n<sub>p</sub>* and *n<sub>fr</sub>* values.
### Detailed Analysis
The chart shows five lines, each representing a different *n<sub>p</sub>* value. The data points are overlaid on these lines, each representing a different *n<sub>fr</sub>* value.
* **n<sub>p</sub> = 1 (Brown Line):** The line starts at approximately 0.45 at 0 tokens, rises sharply to around 0.62 at 1000 tokens, and then plateaus around 0.65-0.70 for higher token counts. Data points for *n<sub>fr</sub>* = 1 are overlaid on this line.
* (0, 0.45) - *n<sub>fr</sub>* = 1
* (1000, 0.62) - *n<sub>fr</sub>* = 1
* (4000, 0.67) - *n<sub>fr</sub>* = 1
* (8000, 0.70) - *n<sub>fr</sub>* = 1
* **n<sub>p</sub> = 2 (Orange Line):** Starts at approximately 0.5 at 0 tokens, rises to around 0.65 at 1000 tokens, and plateaus around 0.68-0.72 for higher token counts. Data points for *n<sub>fr</sub>* = 3 are overlaid on this line.
* (0, 0.5) - *n<sub>fr</sub>* = 3
* (1000, 0.65) - *n<sub>fr</sub>* = 3
* (4000, 0.68) - *n<sub>fr</sub>* = 3
* (8000, 0.72) - *n<sub>fr</sub>* = 3
* **n<sub>p</sub> = 5 (Light Blue Line):** Starts at approximately 0.55 at 0 tokens, rises to around 0.70 at 1000 tokens, and plateaus around 0.72-0.75 for higher token counts. Data points for *n<sub>fr</sub>* = 5 are overlaid on this line.
* (0, 0.55) - *n<sub>fr</sub>* = 5
* (1000, 0.70) - *n<sub>fr</sub>* = 5
* (4000, 0.73) - *n<sub>fr</sub>* = 5
* (8000, 0.75) - *n<sub>fr</sub>* = 5
* **n<sub>p</sub> = 10 (Cyan Line):** Starts at approximately 0.6 at 0 tokens, rises to around 0.75 at 1000 tokens, and plateaus around 0.77-0.80 for higher token counts. Data points for *n<sub>fr</sub>* = 10 are overlaid on this line.
* (0, 0.6) - *n<sub>fr</sub>* = 10
* (1000, 0.75) - *n<sub>fr</sub>* = 10
* (4000, 0.78) - *n<sub>fr</sub>* = 10
* (8000, 0.80) - *n<sub>fr</sub>* = 10
* **n<sub>p</sub> = 25 (Purple Line):** Starts at approximately 0.65 at 0 tokens, rises to around 0.80 at 1000 tokens, and plateaus around 0.80-0.82 for higher token counts.
All lines exhibit a similar trend: an initial increase in mean pass rate with increasing tokens generated, followed by a plateau.
### Key Observations
* Higher values of *n<sub>p</sub>* generally result in higher mean pass rates, especially at lower token counts.
* The effect of *n<sub>p</sub>* diminishes as the number of tokens generated increases; the lines converge at higher token counts.
* The data points for different *n<sub>fr</sub>* values closely follow the corresponding *n<sub>p</sub>* lines, suggesting that *n<sub>fr</sub>* has a less pronounced effect on the pass rate compared to *n<sub>p</sub>*.
* The pass rate appears to stabilize after approximately 2000-4000 tokens generated, regardless of the *n<sub>p</sub>* value.
### Interpretation
The chart suggests that the parameter *n<sub>p</sub>* plays a significant role in determining the pass rate of a process that generates tokens. Increasing *n<sub>p</sub>* initially improves the pass rate, but the benefit diminishes as the number of tokens generated increases. This could indicate that *n<sub>p</sub>* influences the initial quality of the generated tokens, but its impact becomes less important as the process continues.
The relatively small variation in pass rate across different *n<sub>fr</sub>* values suggests that this parameter has a less substantial effect on the overall outcome. The convergence of the lines at higher token counts implies that there's a limit to how much the pass rate can be improved, regardless of the *n<sub>p</sub>* setting.
The plateau in pass rate after a certain number of tokens generated could be due to inherent limitations in the process or the model being used. Further investigation might be needed to understand the underlying reasons for this stabilization. The chart provides valuable insights for optimizing the parameters *n<sub>p</sub>* and *n<sub>fr</sub>* to achieve the desired pass rate for a given number of tokens generated.