## Scatter Plot with Trend Line: Mean Pass Rate vs. Mean Tokens Generated
### Overview
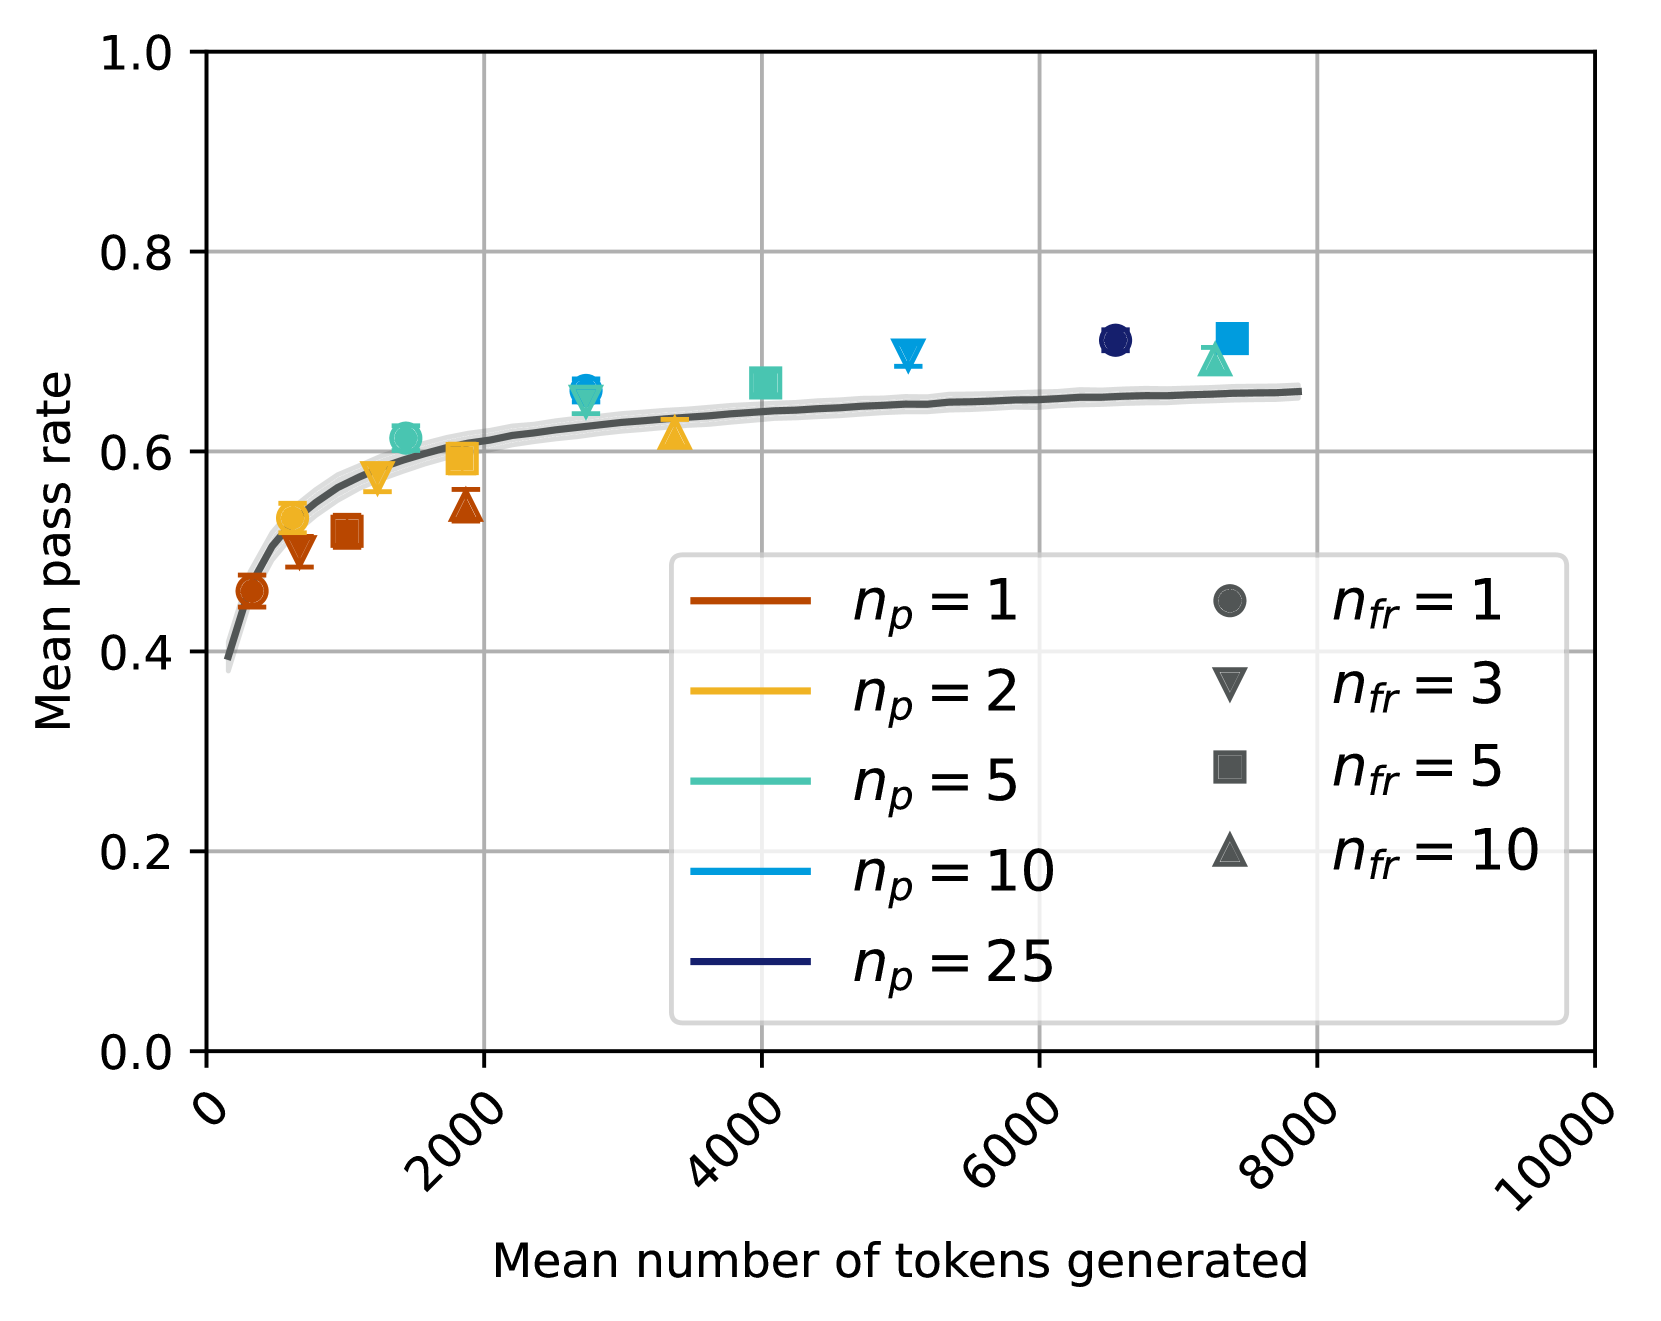
This image is a scatter plot with an overlaid trend line, illustrating the relationship between the mean number of tokens generated (x-axis) and the mean pass rate (y-axis). The data is categorized by two parameters: `n_p` (represented by color) and `n_fr` (represented by marker shape). The plot suggests a logarithmic or saturating relationship where pass rate increases with token count but plateaus.
### Components/Axes
* **X-Axis:** Labeled "Mean number of tokens generated". Scale ranges from 0 to 10,000 with major tick marks at 0, 2000, 4000, 6000, 8000, and 10000.
* **Y-Axis:** Labeled "Mean pass rate". Scale ranges from 0.0 to 1.0 with major tick marks at 0.0, 0.2, 0.4, 0.6, 0.8, and 1.0.
* **Legend (Bottom-Right Quadrant):** Contains two columns.
* **Left Column (Color for `n_p`):**
* Brown line: `n_p = 1`
* Yellow line: `n_p = 2`
* Teal line: `n_p = 5`
* Light Blue line: `n_p = 10`
* Dark Blue line: `n_p = 25`
* **Right Column (Marker Shape for `n_fr`):**
* Circle: `n_fr = 1`
* Downward Triangle: `n_fr = 3`
* Square: `n_fr = 5`
* Upward Triangle: `n_fr = 10`
* **Trend Line:** A single, thick, dark gray line runs through the data points, showing the overall trend. It starts steeply and flattens out.
### Detailed Analysis
Data points are identified by matching the color (for `n_p`) and marker shape (for `n_fr`). Values are approximate based on visual inspection.
**Data Series & Approximate Points (x, y):**
1. **`n_p = 1` (Brown):**
* `n_fr = 1` (Circle): (~500, 0.46)
* `n_fr = 3` (Down Triangle): (~800, 0.50)
* `n_fr = 5` (Square): (~1200, 0.52)
* `n_fr = 10` (Up Triangle): (~1800, 0.54)
2. **`n_p = 2` (Yellow):**
* `n_fr = 1` (Circle): (~700, 0.53)
* `n_fr = 3` (Down Triangle): (~1400, 0.58)
* `n_fr = 5` (Square): (~1900, 0.60)
* `n_fr = 10` (Up Triangle): (~3500, 0.62)
3. **`n_p = 5` (Teal):**
* `n_fr = 1` (Circle): (~1600, 0.61)
* `n_fr = 3` (Down Triangle): (~2700, 0.66)
* `n_fr = 5` (Square): (~4000, 0.67)
* `n_fr = 10` (Up Triangle): (~7500, 0.70)
4. **`n_p = 10` (Light Blue):**
* `n_fr = 3` (Down Triangle): (~5000, 0.70)
* `n_fr = 5` (Square): (~7500, 0.71)
5. **`n_p = 25` (Dark Blue):**
* `n_fr = 1` (Circle): (~6500, 0.71)
**Trend Line Behavior:** The gray trend line begins near (0, 0.40), rises sharply until approximately 2000 tokens (reaching ~0.60), then its slope decreases significantly, approaching a plateau near 0.66-0.67 as tokens approach 8000.
### Key Observations
1. **Positive Correlation:** For all series, the mean pass rate increases as the mean number of tokens generated increases.
2. **Diminishing Returns:** The rate of improvement slows dramatically. The most significant gains in pass rate occur within the first ~2000 tokens. Beyond ~4000 tokens, additional tokens yield very small increases in pass rate.
3. **Effect of `n_p`:** Higher values of `n_p` (warmer to cooler colors: brown -> yellow -> teal -> blue) are associated with higher pass rates for a given token count. The `n_p=25` (dark blue) point achieves the highest observed pass rate (~0.71).
4. **Effect of `n_fr`:** For a fixed `n_p`, increasing `n_fr` (different marker shapes) generally corresponds to a higher mean number of tokens generated and a slightly higher pass rate. This is most clearly seen in the `n_p=1` and `n_p=2` series.
5. **Data Sparsity:** The plot is sparse for high `n_p` values (`n_p=10, 25`) and high `n_fr` values, with only one or two data points each.
### Interpretation
This chart likely visualizes the performance (pass rate) of a generative AI model or system against its output length (token count), under different configurations of two parameters, `n_p` and `n_fr`.
* **Core Finding:** There is a fundamental trade-off or relationship where generating more content (tokens) is associated with a higher probability of success (pass rate), but with severe diminishing returns. The system reaches near-optimal performance after generating a few thousand tokens.
* **Parameter Insights:** `n_p` appears to be a more impactful parameter for boosting the maximum achievable pass rate than `n_fr`. `n_fr` seems to control a trade-off between output length and performance within a given `n_p` setting.
* **Practical Implication:** The data suggests that for this system, allocating resources to generate beyond 4000-6000 tokens provides minimal performance benefit. Optimal efficiency might be found at the "knee" of the curve, around 2000-4000 tokens. The highest performance ceiling is set by the `n_p` parameter.
* **Anomaly/Note:** The single dark blue circle (`n_p=25, n_fr=1`) at (~6500, 0.71) is an outlier in terms of parameter combination but follows the general trend, confirming that even with high `n_p`, the saturating behavior holds.