## Line Chart: Pass@k(%) vs. Number of Sample k
### Overview
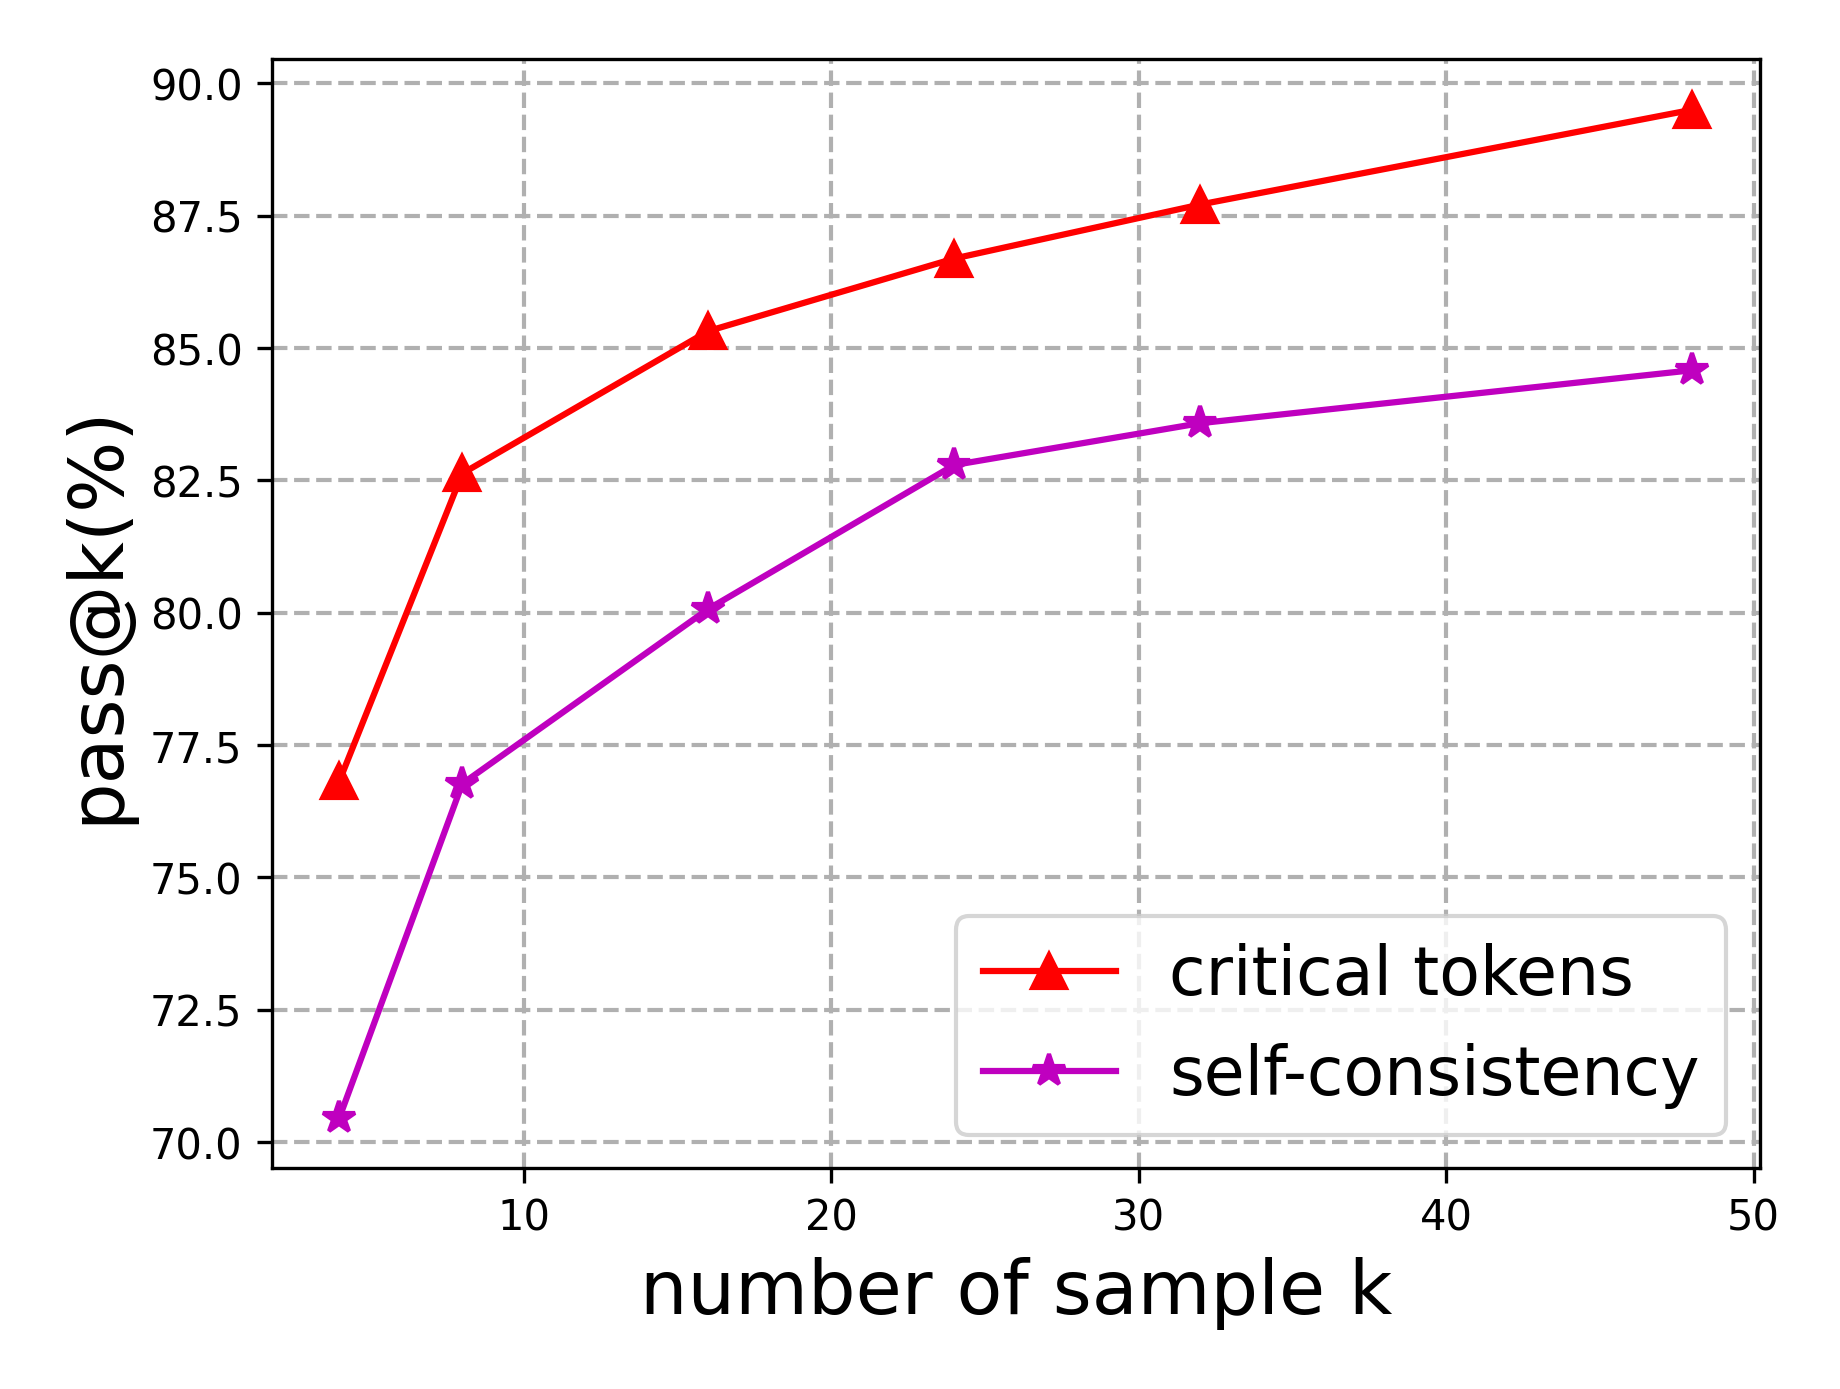
The image is a line chart comparing the performance of "critical tokens" and "self-consistency" methods as the number of samples (k) increases. The y-axis represents "pass@k(%)", indicating the percentage of successful attempts, while the x-axis represents the "number of sample k". The chart shows how the performance of each method changes with an increasing number of samples.
### Components/Axes
* **X-axis:** "number of sample k" with tick marks at 10, 20, 30, 40, and 50.
* **Y-axis:** "pass@k(%)" with tick marks at 70.0, 72.5, 75.0, 77.5, 80.0, 82.5, 85.0, 87.5, and 90.0.
* **Legend:** Located in the bottom-right corner.
* Red line with triangle markers: "critical tokens"
* Purple line with star markers: "self-consistency"
### Detailed Analysis
* **Critical Tokens (Red Line):** The line slopes upward, indicating an increase in "pass@k(%)" as the number of samples increases.
* At k=5, pass@k(%) ≈ 76.8%
* At k=15, pass@k(%) ≈ 85.3%
* At k=25, pass@k(%) ≈ 86.6%
* At k=35, pass@k(%) ≈ 87.7%
* At k=48, pass@k(%) ≈ 89.3%
* **Self-Consistency (Purple Line):** The line also slopes upward, indicating an increase in "pass@k(%)" as the number of samples increases, but at a slower rate compared to "critical tokens".
* At k=5, pass@k(%) ≈ 70.5%
* At k=10, pass@k(%) ≈ 76.8%
* At k=18, pass@k(%) ≈ 80.2%
* At k=25, pass@k(%) ≈ 82.8%
* At k=33, pass@k(%) ≈ 83.6%
* At k=48, pass@k(%) ≈ 84.6%
### Key Observations
* Both methods show improved performance with an increasing number of samples.
* The "critical tokens" method consistently outperforms the "self-consistency" method across all sample sizes shown.
* The rate of improvement for "critical tokens" appears to decrease as the number of samples increases, suggesting diminishing returns.
* The "self-consistency" method shows a more gradual and consistent improvement.
### Interpretation
The chart suggests that increasing the number of samples (k) generally improves the performance of both "critical tokens" and "self-consistency" methods, as measured by "pass@k(%)". However, the "critical tokens" method demonstrates superior performance compared to "self-consistency" across the tested range of sample sizes. The diminishing returns observed for "critical tokens" at higher sample sizes might indicate a point beyond which further increasing the number of samples yields minimal performance gains. The consistent improvement of "self-consistency" suggests it may be more stable or predictable with increasing sample sizes, although its overall performance remains lower.