## Line Chart: pass@k(%) vs. Number of Samples (k)
### Overview
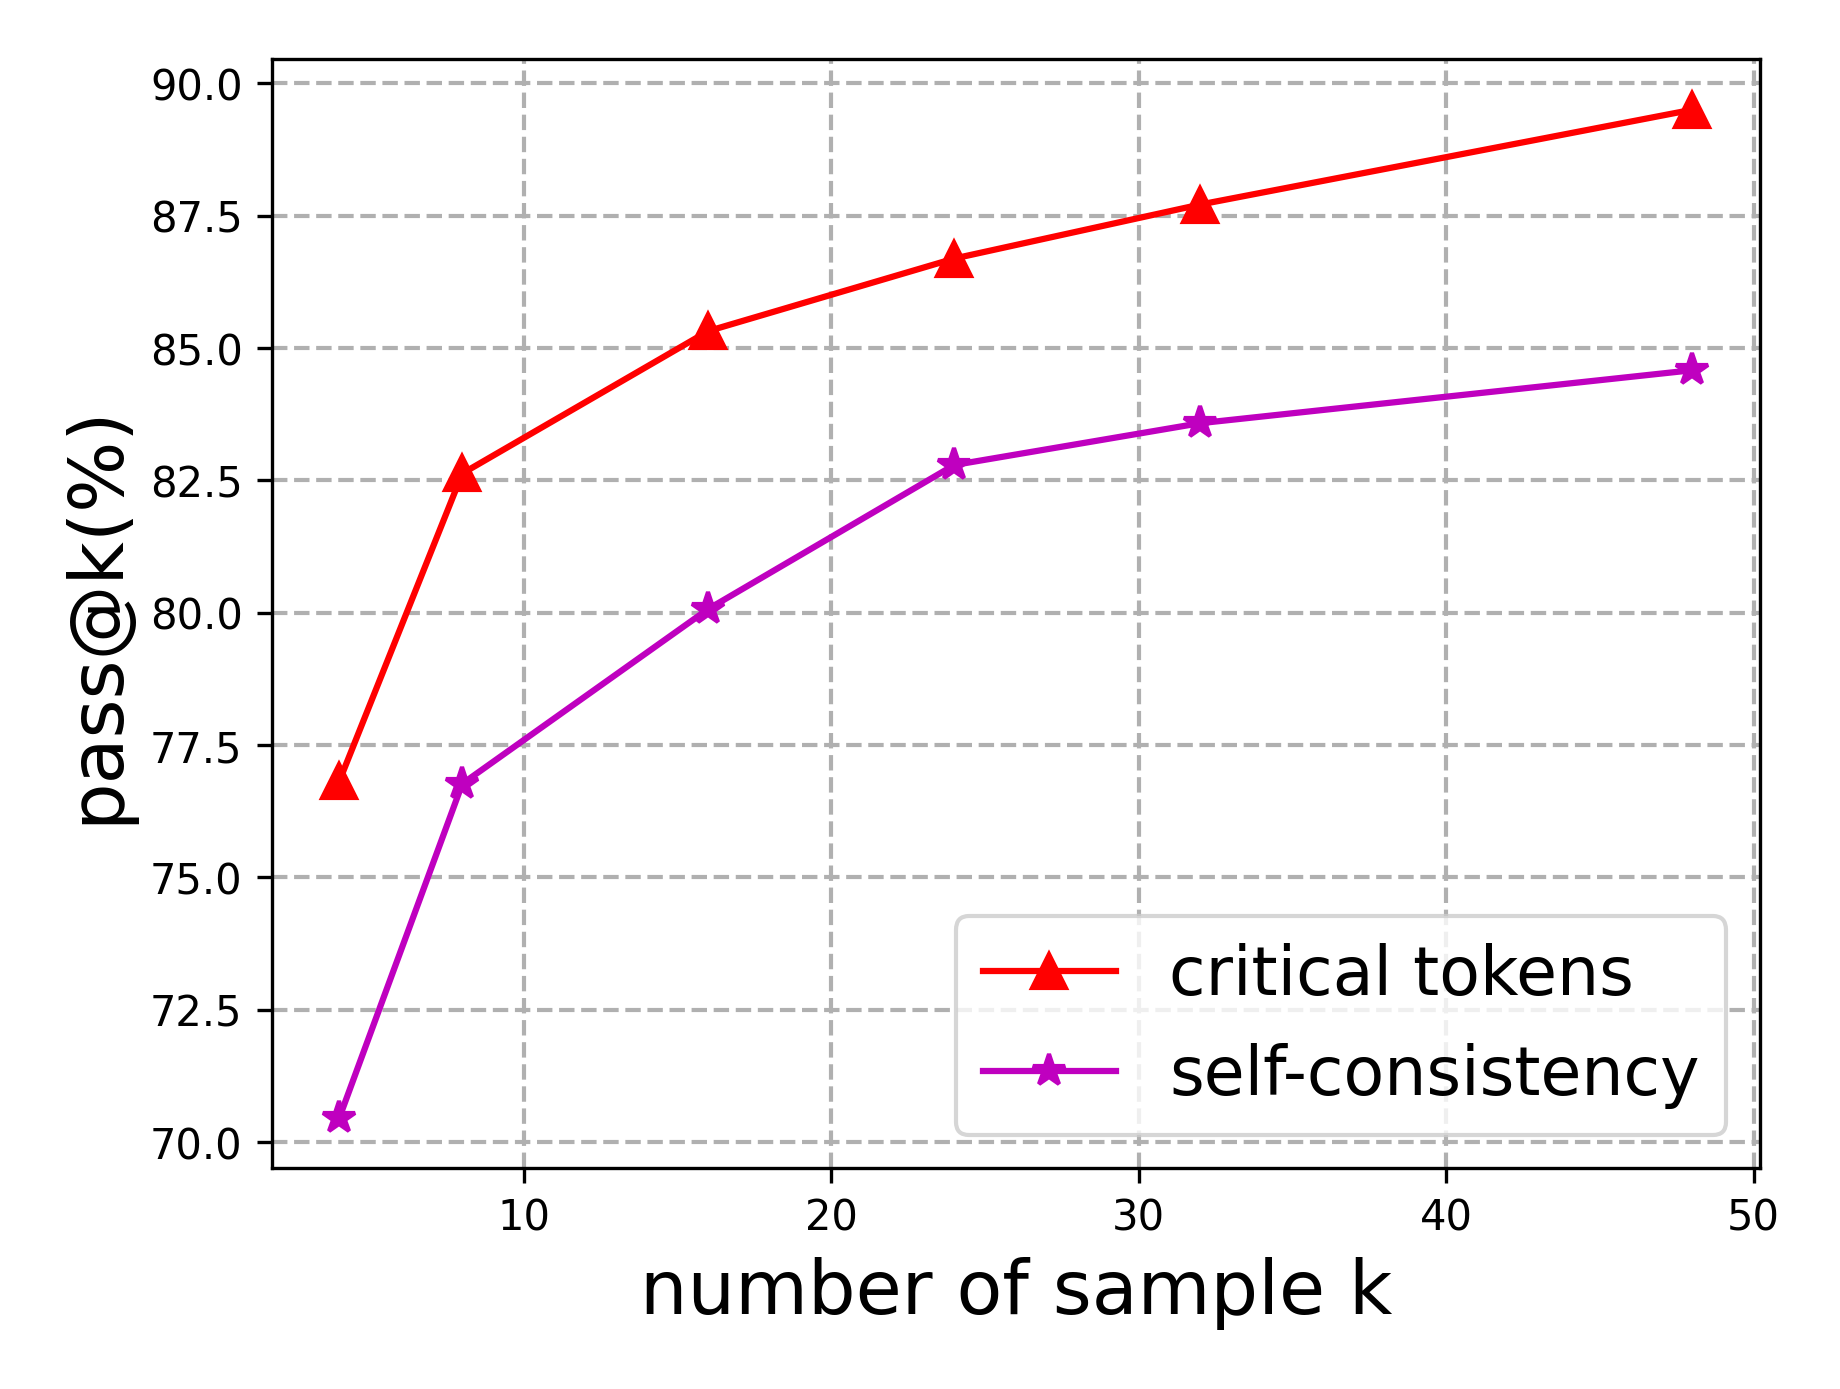
This is a line chart comparing the performance of two methods, "critical tokens" and "self-consistency," as a function of the number of samples (k). The chart plots the pass@k metric (in percentage) against k, showing how performance scales with increased sampling.
### Components/Axes
* **X-Axis (Horizontal):** Labeled "number of sample k". The scale is linear, with major tick marks at 10, 20, 30, 40, and 50. Data points are plotted at approximate k values of 5, 8, 16, 24, 32, and 48.
* **Y-Axis (Vertical):** Labeled "pass@k(%)". The scale is linear, ranging from 70.0 to 90.0, with major tick marks every 2.5 units (70.0, 72.5, 75.0, ..., 90.0).
* **Legend:** Located in the bottom-right corner of the chart area.
* **Red line with upward-pointing triangle markers:** Labeled "critical tokens".
* **Purple (magenta) line with star markers:** Labeled "self-consistency".
* **Grid:** A dashed gray grid is present, aligned with the major tick marks on both axes.
### Detailed Analysis
**Trend Verification:**
* **"critical tokens" (Red line, triangles):** The line shows a clear upward trend, starting steeply and then gradually flattening (diminishing returns). It is consistently positioned above the "self-consistency" line.
* **"self-consistency" (Purple line, stars):** This line also shows a clear upward trend with a similar shape—steep initial rise followed by a more gradual increase. It is consistently below the "critical tokens" line.
**Data Points (Approximate Values):**
* **k ≈ 5:**
* critical tokens: ~77.0%
* self-consistency: ~70.5%
* **k ≈ 8:**
* critical tokens: ~82.5%
* self-consistency: ~77.0%
* **k ≈ 16:**
* critical tokens: ~85.2%
* self-consistency: ~80.1%
* **k ≈ 24:**
* critical tokens: ~86.7%
* self-consistency: ~82.8%
* **k ≈ 32:**
* critical tokens: ~87.7%
* self-consistency: ~83.6%
* **k ≈ 48:**
* critical tokens: ~89.5%
* self-consistency: ~84.6%
### Key Observations
1. **Performance Gap:** The "critical tokens" method maintains a consistent performance advantage over "self-consistency" across all sampled values of k. The gap is approximately 6-7 percentage points at k=5 and narrows slightly to about 5 percentage points at k=48.
2. **Diminishing Returns:** Both methods exhibit diminishing returns. The most significant performance gains occur when increasing k from 5 to 16. The rate of improvement slows considerably for k > 24.
3. **Similar Growth Pattern:** Despite the absolute performance difference, both methods follow a nearly identical logarithmic-like growth curve, suggesting they scale similarly with increased computational effort (more samples).
### Interpretation
The chart demonstrates that for the evaluated task, using a "critical tokens" strategy yields a higher pass@k success rate than a "self-consistency" strategy for any given number of samples (k). This suggests that identifying and focusing on "critical tokens" is a more effective method for improving solution accuracy than relying on the self-consistency of multiple sampled outputs.
The data implies a trade-off between performance and computational cost. While increasing k improves results for both methods, the most cost-effective gains are achieved at lower k values (e.g., moving from 5 to 16 samples). The persistent gap between the lines indicates that the "critical tokens" method is fundamentally more efficient, achieving a given performance level with fewer samples than "self-consistency." For instance, "critical tokens" at k≈8 achieves a similar pass@k rate (~82.5%) as "self-consistency" at k≈24 (~82.8%).