## Chart: Performance Comparison of AlphaEvolve and Keich Construction
### Overview
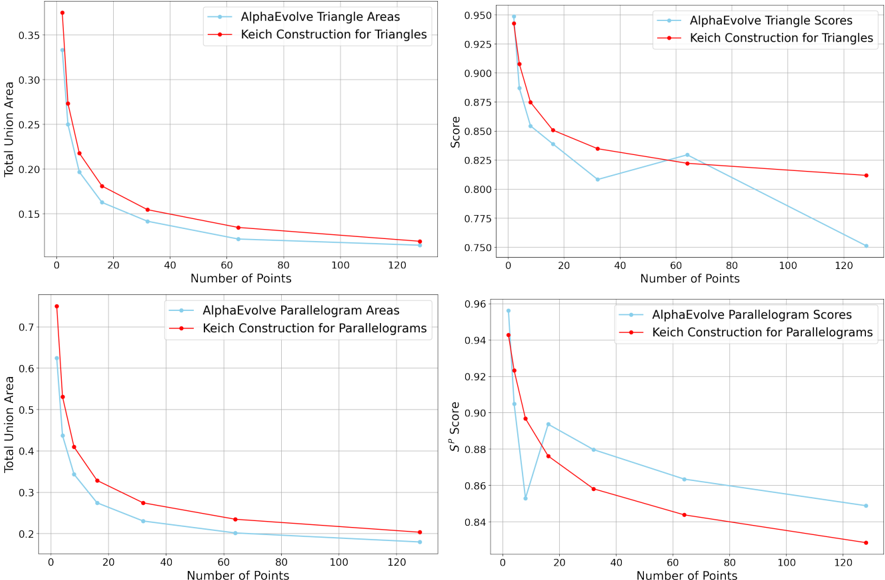
The image presents four line charts comparing the performance of two algorithms, "AlphaEvolve" and "Keich Construction," across different numbers of points. The charts are organized in a 2x2 grid. The top row compares the algorithms for triangles, and the bottom row compares them for parallelograms. The left column shows "Total Union Area," and the right column shows "Score."
### Components/Axes
**General Chart Features:**
* All four charts share the same x-axis: "Number of Points," ranging from 0 to 120 in increments of 20.
* Each chart contains two data series, represented by lines with markers: "AlphaEvolve" (light blue) and "Keich Construction" (red).
* Each chart has a title indicating the shapes being compared (Triangles or Parallelograms) and the metric (Total Union Area or Score).
* All charts have a grid in the background.
**Chart 1 (Top-Left): AlphaEvolve vs. Keich Construction for Triangles (Total Union Area)**
* Y-axis: "Total Union Area," ranging from 0.15 to 0.35.
**Chart 2 (Top-Right): AlphaEvolve vs. Keich Construction for Triangles (Score)**
* Y-axis: "Score," ranging from 0.750 to 0.950.
**Chart 3 (Bottom-Left): AlphaEvolve vs. Keich Construction for Parallelograms (Total Union Area)**
* Y-axis: "Total Union Area," ranging from 0.2 to 0.7.
**Chart 4 (Bottom-Right): AlphaEvolve vs. Keich Construction for Parallelograms (Score)**
* Y-axis: "SP Score," ranging from 0.84 to 0.96.
### Detailed Analysis
**Chart 1: AlphaEvolve vs. Keich Construction for Triangles (Total Union Area)**
* **AlphaEvolve Triangle Areas (Light Blue):** The line starts at approximately 0.33 at 0 points and decreases rapidly to approximately 0.16 at 20 points. It then decreases more gradually, reaching approximately 0.13 at 120 points.
* **Keich Construction for Triangles (Red):** The line starts at approximately 0.37 at 0 points and decreases rapidly to approximately 0.18 at 20 points. It then decreases more gradually, reaching approximately 0.12 at 120 points.
**Chart 2: AlphaEvolve vs. Keich Construction for Triangles (Score)**
* **AlphaEvolve Triangle Scores (Light Blue):** The line starts at approximately 0.94 at 0 points and decreases rapidly to approximately 0.86 at 10 points. It then decreases to approximately 0.81 at 30 points, increases to approximately 0.83 at 60 points, and decreases to approximately 0.75 at 120 points.
* **Keich Construction for Triangles (Red):** The line starts at approximately 0.95 at 0 points and decreases rapidly to approximately 0.87 at 10 points. It then decreases more gradually, reaching approximately 0.82 at 120 points.
**Chart 3: AlphaEvolve vs. Keich Construction for Parallelograms (Total Union Area)**
* **AlphaEvolve Parallelogram Areas (Light Blue):** The line starts at approximately 0.72 at 0 points and decreases rapidly to approximately 0.32 at 20 points. It then decreases more gradually, reaching approximately 0.21 at 120 points.
* **Keich Construction for Parallelograms (Red):** The line starts at approximately 0.74 at 0 points and decreases rapidly to approximately 0.40 at 20 points. It then decreases more gradually, reaching approximately 0.22 at 120 points.
**Chart 4: AlphaEvolve vs. Keich Construction for Parallelograms (Score)**
* **AlphaEvolve Parallelogram Scores (Light Blue):** The line starts at approximately 0.96 at 0 points and decreases rapidly to approximately 0.85 at 10 points. It then increases to approximately 0.90 at 20 points, and decreases gradually to approximately 0.85 at 120 points.
* **Keich Construction for Parallelograms (Red):** The line starts at approximately 0.95 at 0 points and decreases rapidly to approximately 0.88 at 10 points. It then decreases more gradually, reaching approximately 0.85 at 120 points.
### Key Observations
* In all four charts, both algorithms show a decrease in "Total Union Area" and "Score" as the "Number of Points" increases.
* The decrease is most rapid in the initial stages (0-20 points) and then becomes more gradual.
* For "Total Union Area," Keich Construction consistently has a slightly higher value than AlphaEvolve.
* For "Score," the performance difference between the two algorithms is less consistent, with AlphaEvolve sometimes performing better and sometimes worse than Keich Construction.
### Interpretation
The charts suggest that both AlphaEvolve and Keich Construction algorithms experience a decline in performance (both in terms of "Total Union Area" and "Score") as the number of points increases. This could be due to the increasing complexity of the shapes with more points, making it harder for the algorithms to accurately calculate the union area or score.
Keich Construction generally achieves a higher "Total Union Area" compared to AlphaEvolve, indicating that it might be more effective in accurately representing the combined area of the shapes. However, the "Score" metric shows a more nuanced picture, with the relative performance of the two algorithms varying depending on the number of points and the type of shape (triangle or parallelogram).
The initial rapid decline in performance followed by a more gradual decrease suggests that the algorithms are most sensitive to the initial increase in complexity, and their performance stabilizes as the number of points continues to increase.