\n
## Charts: AlphaEvolve vs. Keich Construction Performance
### Overview
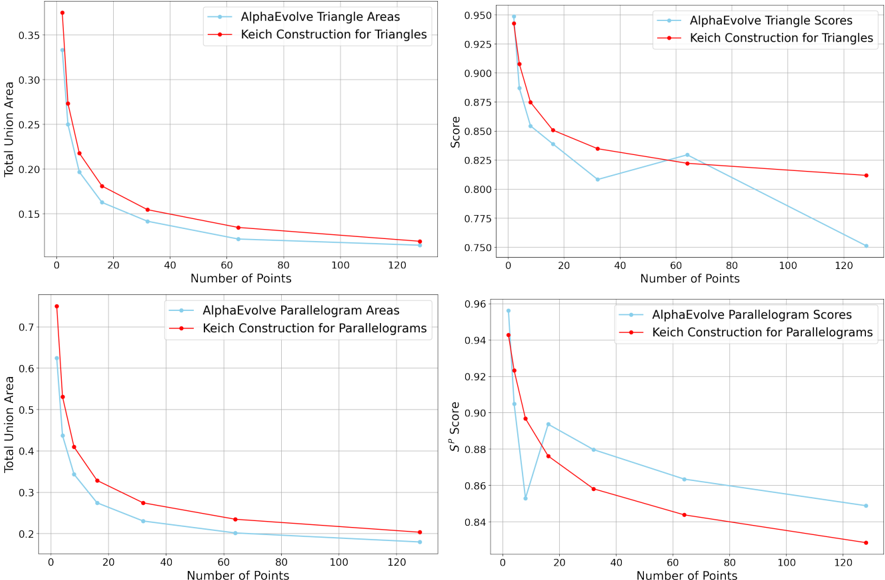
The image presents four separate line charts comparing the performance of two algorithms, "AlphaEvolve" and "Keich Construction," across two geometric shapes: triangles and parallelograms. Each chart plots a metric (Total Union Area or Score) against the number of points used, ranging from 0 to 120.
### Components/Axes
Each chart shares the following components:
* **X-axis:** "Number of Points" (Scale: 0 to 120, increments of 20)
* **Y-axis:** Varies depending on the chart (see below)
* **Legend:** Located in the top-right corner of each chart, distinguishing between "AlphaEvolve" (represented by a light blue line with a circle marker) and "Keich Construction" (represented by a red line with a cross marker).
Specific Y-axis labels:
* Top-Left: "Total Union Area" (Scale: 0.14 to 0.35, increments of approximately 0.05)
* Top-Right: "Score" (Scale: 0.75 to 0.95, increments of approximately 0.025)
* Bottom-Left: "Total Union Area" (Scale: 0.18 to 0.7, increments of approximately 0.1)
* Bottom-Right: "SP Score" (Scale: 0.84 to 0.96, increments of approximately 0.02)
### Detailed Analysis or Content Details
**1. AlphaEvolve Triangle Areas vs. Keich Construction for Triangles**
* **AlphaEvolve (light blue):** The line slopes downward, starting at approximately 0.32 at 0 points and decreasing to approximately 0.16 at 120 points.
* Data points (approximate): (0, 0.32), (20, 0.24), (40, 0.21), (60, 0.19), (80, 0.18), (100, 0.17), (120, 0.16)
* **Keich Construction (red):** The line also slopes downward, starting at approximately 0.28 at 0 points and decreasing to approximately 0.15 at 120 points.
* Data points (approximate): (0, 0.28), (20, 0.22), (40, 0.20), (60, 0.18), (80, 0.17), (100, 0.16), (120, 0.15)
**2. AlphaEvolve Triangle Scores vs. Keich Construction for Triangles**
* **AlphaEvolve (light blue):** The line slopes downward, starting at approximately 0.94 at 0 points and decreasing to approximately 0.81 at 120 points.
* Data points (approximate): (0, 0.94), (20, 0.89), (40, 0.86), (60, 0.84), (80, 0.83), (100, 0.82), (120, 0.81)
* **Keich Construction (red):** The line slopes downward, starting at approximately 0.91 at 0 points and decreasing to approximately 0.80 at 120 points.
* Data points (approximate): (0, 0.91), (20, 0.86), (40, 0.84), (60, 0.83), (80, 0.82), (100, 0.81), (120, 0.80)
**3. AlphaEvolve Parallelogram Areas vs. Keich Construction for Parallelograms**
* **AlphaEvolve (light blue):** The line slopes downward, starting at approximately 0.65 at 0 points and decreasing to approximately 0.22 at 120 points.
* Data points (approximate): (0, 0.65), (20, 0.45), (40, 0.35), (60, 0.30), (80, 0.27), (100, 0.25), (120, 0.22)
* **Keich Construction (red):** The line slopes downward, starting at approximately 0.55 at 0 points and decreasing to approximately 0.20 at 120 points.
* Data points (approximate): (0, 0.55), (20, 0.40), (40, 0.32), (60, 0.28), (80, 0.25), (100, 0.23), (120, 0.20)
**4. AlphaEvolve Parallelogram Scores vs. Keich Construction for Parallelograms**
* **AlphaEvolve (light blue):** The line slopes downward, starting at approximately 0.95 at 0 points and decreasing to approximately 0.86 at 120 points.
* Data points (approximate): (0, 0.95), (20, 0.92), (40, 0.90), (60, 0.89), (80, 0.88), (100, 0.87), (120, 0.86)
* **Keich Construction (red):** The line slopes downward, starting at approximately 0.90 at 0 points and decreasing to approximately 0.84 at 120 points.
* Data points (approximate): (0, 0.90), (20, 0.87), (40, 0.86), (60, 0.85), (80, 0.84), (100, 0.84), (120, 0.84)
### Key Observations
* In all four charts, both algorithms exhibit a decreasing trend as the number of points increases. This suggests that adding more points leads to a reduction in both Total Union Area and Score.
* For triangles, the difference between AlphaEvolve and Keich Construction is relatively small for both Area and Score.
* For parallelograms, the difference between the algorithms is more pronounced, particularly in the Total Union Area chart. AlphaEvolve consistently yields a higher Area than Keich Construction.
* The rate of decrease appears to slow down as the number of points increases in all charts.
### Interpretation
The data suggests that both AlphaEvolve and Keich Construction algorithms improve (or at least don't worsen significantly) with an increasing number of points, up to a certain point. Beyond that, adding more points yields diminishing returns, and potentially even a decrease in performance as measured by Total Union Area and Score.
The differences in performance between the two algorithms are shape-dependent. For triangles, the algorithms perform similarly, indicating that the shape doesn't significantly influence their relative effectiveness. However, for parallelograms, AlphaEvolve appears to be more effective at maximizing the Total Union Area, while both algorithms converge in terms of Score.
The decreasing trend in Total Union Area could indicate that the algorithms are becoming more refined in their approximations, potentially leading to a more accurate representation of the shape but at the cost of overall area. The decreasing trend in Score might suggest that the algorithms are optimizing for a different metric that is negatively correlated with the number of points.
The fact that the rate of decrease slows down with more points suggests that there is a limit to the improvement that can be achieved by simply adding more points. Further optimization might require exploring different algorithmic approaches or parameter settings.