TECHNICAL ASSET FINGERPRINT
850439480844c8ee2dd6fd56
Click to view fullscreen
Press ESC or click to close
FOUND IN PAPERS
EXPERT: healer-alpha-free VERSION 1
RUNTIME: free/openrouter/healer-alpha
INTEL_VERIFIED
\n
## Line Charts: Comparative Performance of AlphaEvolve vs. Keich Construction
### Overview
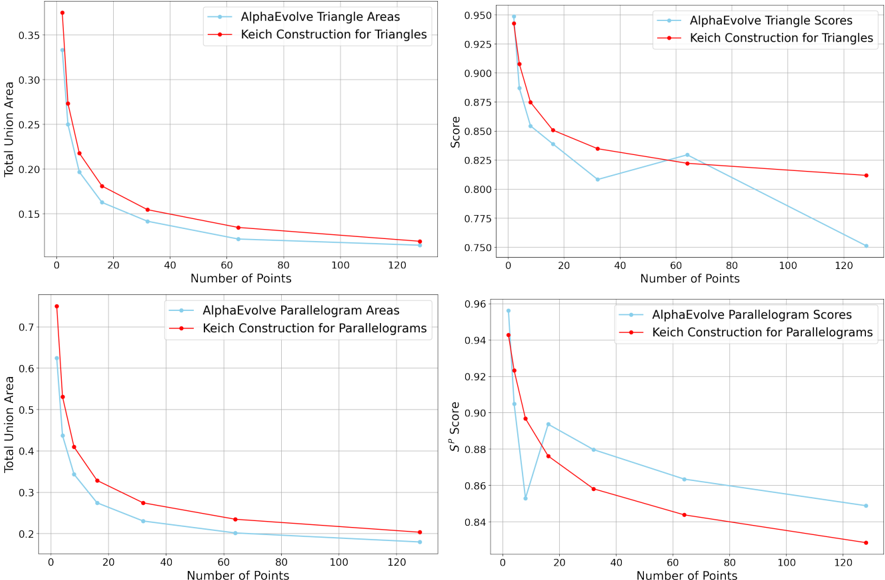
The image contains four line charts arranged in a 2x2 grid. They compare the performance of two methods—"AlphaEvolve" (light blue line) and "Keich Construction" (red line)—across two geometric shapes (Triangles and Parallelograms) using two different metrics ("Total Union Area" and "Score"/"S^D Score"). The independent variable for all charts is the "Number of Points" on the x-axis.
### Components/Axes
**Common Elements:**
* **X-Axis (All Charts):** Labeled "Number of Points". The scale runs from 0 to approximately 130, with major tick marks at 0, 20, 40, 60, 80, 100, 120.
* **Legend (All Charts):** Positioned in the top-right corner of each chart's plot area. It consistently uses:
* Light blue line with circular markers: "AlphaEvolve [Shape] [Metric]"
* Red line with circular markers: "Keich Construction for [Shape]s"
* **Grid:** Light gray grid lines are present for both axes in all charts.
**Chart-Specific Components:**
1. **Top-Left Chart:**
* **Title (Implied by Legend):** Triangle Areas
* **Y-Axis Label:** "Total Union Area"
* **Y-Axis Scale:** 0.15 to 0.35, with major ticks at 0.15, 0.20, 0.25, 0.30, 0.35.
2. **Top-Right Chart:**
* **Title (Implied by Legend):** Triangle Scores
* **Y-Axis Label:** "Score"
* **Y-Axis Scale:** 0.750 to 0.950, with major ticks at 0.750, 0.775, 0.800, 0.825, 0.850, 0.875, 0.900, 0.925, 0.950.
3. **Bottom-Left Chart:**
* **Title (Implied by Legend):** Parallelogram Areas
* **Y-Axis Label:** "Total Union Area"
* **Y-Axis Scale:** 0.2 to 0.7, with major ticks at 0.2, 0.3, 0.4, 0.5, 0.6, 0.7.
4. **Bottom-Right Chart:**
* **Title (Implied by Legend):** Parallelogram Scores
* **Y-Axis Label:** "S^D Score"
* **Y-Axis Scale:** 0.84 to 0.96, with major ticks at 0.84, 0.86, 0.88, 0.90, 0.92, 0.94, 0.96.
### Detailed Analysis
**1. Top-Left: Triangle Areas (Total Union Area vs. Number of Points)**
* **Trend Verification:** Both lines show a steep, decaying decrease in Total Union Area as the Number of Points increases. The red line (Keich) is consistently above the blue line (AlphaEvolve).
* **Data Points (Approximate):**
* **At ~0 Points:** AlphaEvolve ≈ 0.33, Keich ≈ 0.37
* **At ~20 Points:** AlphaEvolve ≈ 0.16, Keich ≈ 0.18
* **At ~40 Points:** AlphaEvolve ≈ 0.14, Keich ≈ 0.155
* **At ~130 Points:** AlphaEvolve ≈ 0.12, Keich ≈ 0.125
**2. Top-Right: Triangle Scores (Score vs. Number of Points)**
* **Trend Verification:** Both lines generally decrease. The red line (Keich) shows a smoother, monotonic decline. The blue line (AlphaEvolve) declines more steeply initially, has a notable dip around 30 points, a slight recovery around 65 points, then continues declining.
* **Data Points (Approximate):**
* **At ~0 Points:** AlphaEvolve ≈ 0.945, Keich ≈ 0.940
* **At ~20 Points:** AlphaEvolve ≈ 0.850, Keich ≈ 0.875
* **At ~30 Points (Dip):** AlphaEvolve ≈ 0.810
* **At ~65 Points (Recovery):** AlphaEvolve ≈ 0.830, Keich ≈ 0.825
* **At ~130 Points:** AlphaEvolve ≈ 0.755, Keich ≈ 0.815
**3. Bottom-Left: Parallelogram Areas (Total Union Area vs. Number of Points)**
* **Trend Verification:** Similar to triangles, both lines show a steep, decaying decrease. The red line (Keich) is consistently above the blue line (AlphaEvolve).
* **Data Points (Approximate):**
* **At ~0 Points:** AlphaEvolve ≈ 0.63, Keich ≈ 0.73
* **At ~20 Points:** AlphaEvolve ≈ 0.27, Keich ≈ 0.33
* **At ~40 Points:** AlphaEvolve ≈ 0.23, Keich ≈ 0.28
* **At ~130 Points:** AlphaEvolve ≈ 0.18, Keich ≈ 0.20
**4. Bottom-Right: Parallelogram Scores (S^D Score vs. Number of Points)**
* **Trend Verification:** Both lines show an overall decreasing trend. The red line (Keich) decreases smoothly. The blue line (AlphaEvolve) has a very sharp drop from ~0 to ~10 points, a sharp rebound to a peak at ~20 points, then a steady decline.
* **Data Points (Approximate):**
* **At ~0 Points:** AlphaEvolve ≈ 0.955, Keich ≈ 0.945
* **At ~10 Points (Trough):** AlphaEvolve ≈ 0.855
* **At ~20 Points (Peak):** AlphaEvolve ≈ 0.895, Keich ≈ 0.875
* **At ~65 Points:** AlphaEvolve ≈ 0.865, Keich ≈ 0.845
* **At ~130 Points:** AlphaEvolve ≈ 0.850, Keich ≈ 0.825
### Key Observations
1. **Consistent Superiority in Area Metric:** For both triangles and parallelograms, the Keich Construction method (red line) consistently yields a higher "Total Union Area" than AlphaEvolve across all sampled numbers of points.
2. **Divergent Performance in Score Metrics:**
* For triangles, Keich maintains a higher score than AlphaEvolve for most of the range, especially at higher point counts.
* For parallelograms, AlphaEvolve starts with a higher score, suffers a severe drop, recovers to surpass Keich at ~20 points, but then falls below Keich again as the number of points increases beyond ~65.
3. **Volatility in AlphaEvolve Scores:** The AlphaEvolve method exhibits non-monotonic behavior in its score metrics (top-right and bottom-right charts), with distinct dips and recoveries, unlike the smooth decay of the Keich method.
4. **Shape-Dependent Behavior:** The performance gap and trends differ between triangles and parallelograms, suggesting the methods' effectiveness is sensitive to the underlying geometric shape.
### Interpretation
The data suggests a fundamental trade-off between the two methods. **Keich Construction** appears to be a more stable and predictable algorithm, consistently producing results with larger union areas and smoothly decaying scores as problem complexity (number of points) increases. This reliability might make it preferable for applications where consistent, monotonic behavior is critical.
**AlphaEvolve**, in contrast, shows signs of being a more complex or potentially adaptive method. Its initial high scores (especially for parallelograms) and non-linear responses (dips and peaks) could indicate an optimization process that is sensitive to initial conditions or specific point configurations. The sharp drop and recovery in the parallelogram score chart is particularly notable—it may represent a phase transition or a point where the algorithm's strategy changes. However, its generally lower union area and tendency to be outscored by Keich at high point counts suggest it may not scale as effectively or may prioritize different objectives than pure area maximization.
In essence, Keich Construction seems optimized for consistent, area-focused outcomes, while AlphaEvolve's behavior hints at a more dynamic process that might excel in specific regimes but lacks the robustness of Keich across the tested range. The choice between them would depend on whether the priority is reliable area coverage (favoring Keich) or potential high-performance in specific, lower-complexity scenarios (where AlphaEvolve's initial scores are competitive).
DECODING INTELLIGENCE...