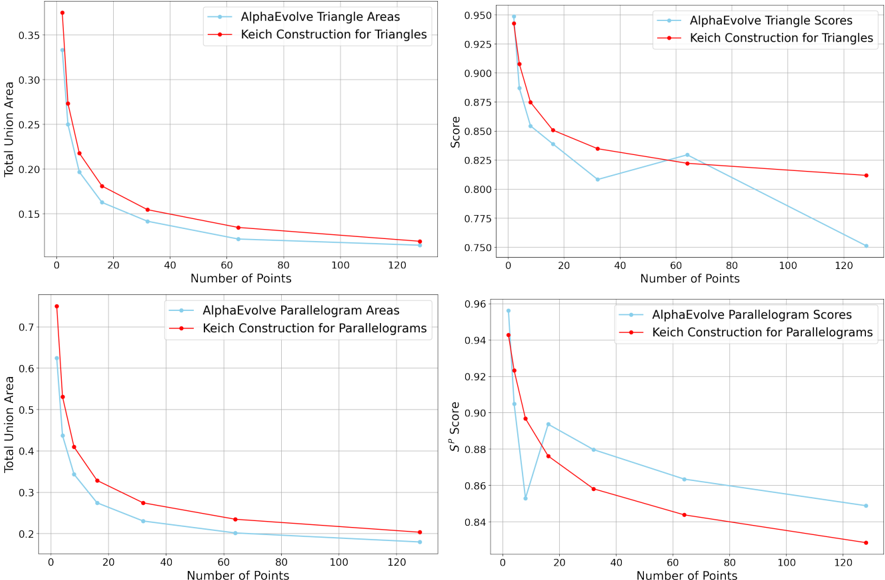
## Chart Type: Comparative Line Graphs
### Overview
The image contains four comparative line graphs arranged in a 2x2 grid. Each graph evaluates two methods—**AlphaEvolve** (blue line) and **Keich Construction** (red line)—across different metrics:
1. **Top Left**: Total Union Area for Triangles
2. **Top Right**: Scores for Triangles
3. **Bottom Left**: Total Union Area for Parallelograms
4. **Bottom Right**: S_p Scores for Parallelograms
All graphs share the same x-axis ("Number of Points," 0–120) but differ in y-axis labels and value ranges.
---
### Components/Axes
#### Common Elements
- **X-Axis**: "Number of Points" (0–120, increments of 20).
- **Legends**: Positioned at the top-right of each graph.
- **Blue**: AlphaEvolve
- **Red**: Keich Construction
#### Graph-Specific Axes
1. **Top Left (Triangles - Union Area)**:
- Y-Axis: "Total Union Area" (0.15–0.35).
2. **Top Right (Triangles - Scores)**:
- Y-Axis: "Score" (0.75–0.95).
3. **Bottom Left (Parallelograms - Union Area)**:
- Y-Axis: "Total Union Area" (0.2–0.7).
4. **Bottom Right (Parallelograms - S_p Scores)**:
- Y-Axis: "S_p Score" (0.84–0.96).
---
### Detailed Analysis
#### Top Left: Total Union Area for Triangles
- **AlphaEvolve (Blue)**:
- Starts at ~0.34 (0 points), drops sharply to ~0.12 (120 points).
- Steep decline until ~20 points, then gradual flattening.
- **Keich Construction (Red)**:
- Starts at ~0.38 (0 points), declines to ~0.13 (120 points).
- Slightly less steep than AlphaEvolve.
- **Key Trend**: Both methods show diminishing returns as points increase.
#### Top Right: Scores for Triangles
- **AlphaEvolve (Blue)**:
- Peaks at ~0.95 (0 points), drops to ~0.75 (120 points).
- Sharp decline until ~40 points, then gradual decline.
- **Keich Construction (Red)**:
- Starts at ~0.94 (0 points), declines to ~0.78 (120 points).
- More stable than AlphaEvolve, with a gentler slope.
- **Key Trend**: Keich Construction maintains higher scores across all point counts.
#### Bottom Left: Total Union Area for Parallelograms
- **AlphaEvolve (Blue)**:
- Starts at ~0.62 (0 points), drops to ~0.2 (120 points).
- Steep decline until ~20 points, then gradual flattening.
- **Keich Construction (Red)**:
- Starts at ~0.54 (0 points), declines to ~0.2 (120 points).
- Slightly less steep than AlphaEvolve.
- **Key Trend**: Both methods show similar patterns, but AlphaEvolve starts stronger.
#### Bottom Right: S_p Scores for Parallelograms
- **AlphaEvolve (Blue)**:
- Peaks at ~0.96 (0 points), drops to ~0.85 (120 points).
- Sharp decline until ~20 points, then gradual decline.
- **Keich Construction (Red)**:
- Starts at ~0.94 (0 points), declines to ~0.83 (120 points).
- More stable than AlphaEvolve, with a gentler slope.
- **Key Trend**: Keich Construction maintains higher scores across all point counts.
---
### Key Observations
1. **Consistent Performance**: Keich Construction outperforms AlphaEvolve in all metrics except the initial point (0 points) for Union Area in triangles.
2. **Divergence at Low Points**: AlphaEvolve starts stronger in Union Area (triangles and parallelograms) but declines sharply as points increase.
3. **Stability**: Keich Construction shows more consistent performance across increasing point counts.
4. **Score Metrics**: Both methods exhibit similar trends in score evaluations, with Keich Construction maintaining higher values.
---
### Interpretation
- **Method Comparison**: Keich Construction appears more robust for higher point counts, suggesting better scalability or efficiency in geometric computations.
- **AlphaEvolve’s Trade-off**: While AlphaEvolve achieves higher initial values (e.g., Union Area at 0 points), its rapid decline indicates potential inefficiencies or instability as complexity (number of points) increases.
- **Practical Implications**: For applications requiring stability at scale (e.g., large datasets or complex shapes), Keich Construction may be preferable. AlphaEvolve could be suitable for scenarios prioritizing initial performance over long-term scalability.
- **Anomalies**: No outliers detected; trends align with expected diminishing returns in geometric computations.