## Scatter Plots: Test Time Accuracy vs. Max Thinking Length
### Overview
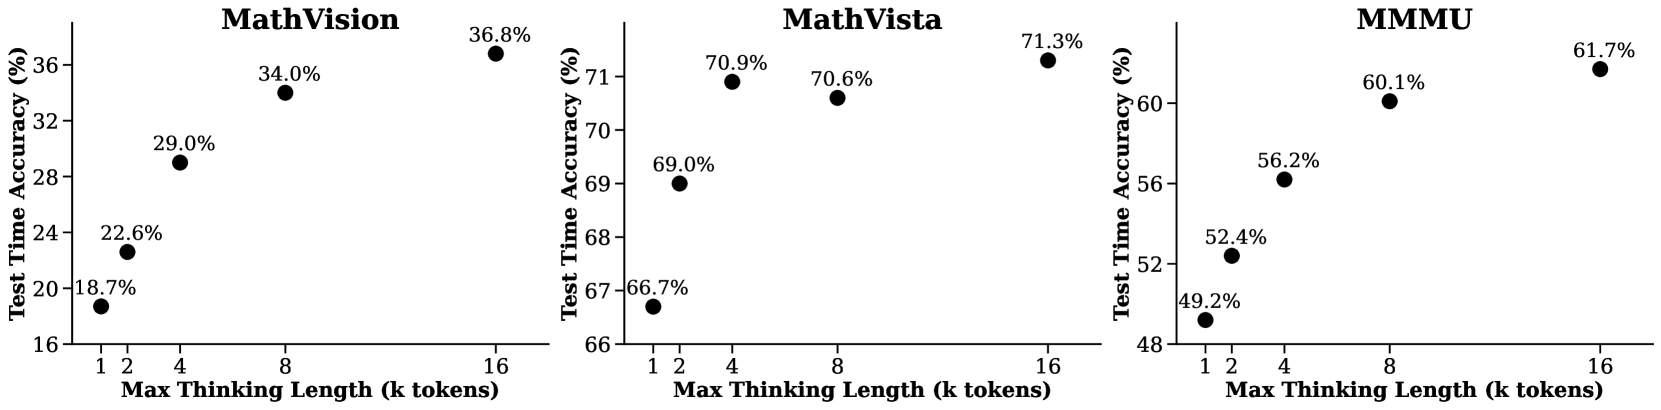
The image contains three scatter plots comparing **Test Time Accuracy (%)** against **Max Thinking Length (k tokens)** for three different systems: **MathVision**, **MathVista**, and **MMU**. Each plot shows a clear upward trend, indicating that longer thinking lengths correlate with higher accuracy.
---
### Components/Axes
1. **X-Axis (Horizontal)**:
- Label: **Max Thinking Length (k tokens)**
- Values: 1, 2, 4, 8, 16 (logarithmic scale).
2. **Y-Axis (Vertical)**:
- Label: **Test Time Accuracy (%)**
- Ranges:
- MathVision: 16%–36%
- MathVista: 66%–71%
- MMU: 48%–62%
3. **Legends**:
- Positioned at the top of each plot, labeled with the system name (MathVision, MathVista, MMU).
- Data points are black dots with percentage labels.
---
### Detailed Analysis
#### MathVision
- **Data Points**:
- 1k tokens: 18.7%
- 2k tokens: 22.6%
- 4k tokens: 29.0%
- 8k tokens: 34.0%
- 16k tokens: 36.8%
- **Trend**: Gradual increase in accuracy with longer thinking lengths.
#### MathVista
- **Data Points**:
- 1k tokens: 66.7%
- 2k tokens: 69.0%
- 4k tokens: 70.6%
- 8k tokens: 70.9%
- 16k tokens: 71.3%
- **Trend**: Steeper initial improvement, plateauing near 71% at 16k tokens.
#### MMU
- **Data Points**:
- 1k tokens: 49.2%
- 2k tokens: 52.4%
- 4k tokens: 56.2%
- 8k tokens: 60.1%
- 16k tokens: 61.7%
- **Trend**: Consistent upward trajectory, but slower growth compared to MathVista.
---
### Key Observations
1. **MathVista** achieves the highest accuracy (71.3% at 16k tokens), outperforming both MathVision and MMU.
2. **MathVision** shows the lowest baseline accuracy (18.7% at 1k tokens) but improves significantly with longer thinking lengths.
3. **MMU** has moderate accuracy (61.7% at 16k tokens) with a steady but gradual improvement.
4. All systems exhibit diminishing returns at higher thinking lengths (e.g., MathVista’s accuracy increases by only 0.4% between 8k and 16k tokens).
---
### Interpretation
- **Performance Correlation**: Longer thinking lengths consistently improve accuracy across all systems, suggesting that extended computation time allows for better problem-solving.
- **Model Efficiency**:
- **MathVista** demonstrates the most efficient scaling, achieving near-peak accuracy (71.3%) with minimal additional gains at 16k tokens.
- **MathVision** requires the longest thinking length (16k tokens) to reach its peak (36.8%), indicating potential inefficiencies in its reasoning process.
- **MMU** balances moderate accuracy with steady improvement, though it lags behind MathVista in both baseline and peak performance.
- **Diminishing Returns**: The flattening trends at higher thinking lengths (e.g., MathVista’s 70.9% → 71.3% increase) suggest a practical limit to the benefits of extended computation.
This data highlights the trade-off between computational resources and accuracy, with MathVista emerging as the most effective system for maximizing test time accuracy.