TECHNICAL ASSET FINGERPRINT
85070eb8dcaed1f192c44ff6
Click to view fullscreen
Press ESC or click to close
FOUND IN PAPERS
EXPERT: gemini-2.0-flash VERSION 1
RUNTIME: nugit/gemini/gemini-2.0-flash
INTEL_VERIFIED
## Line Chart: Model Accuracy vs. Training Progress for Various Datasets and Model Sizes
### Overview
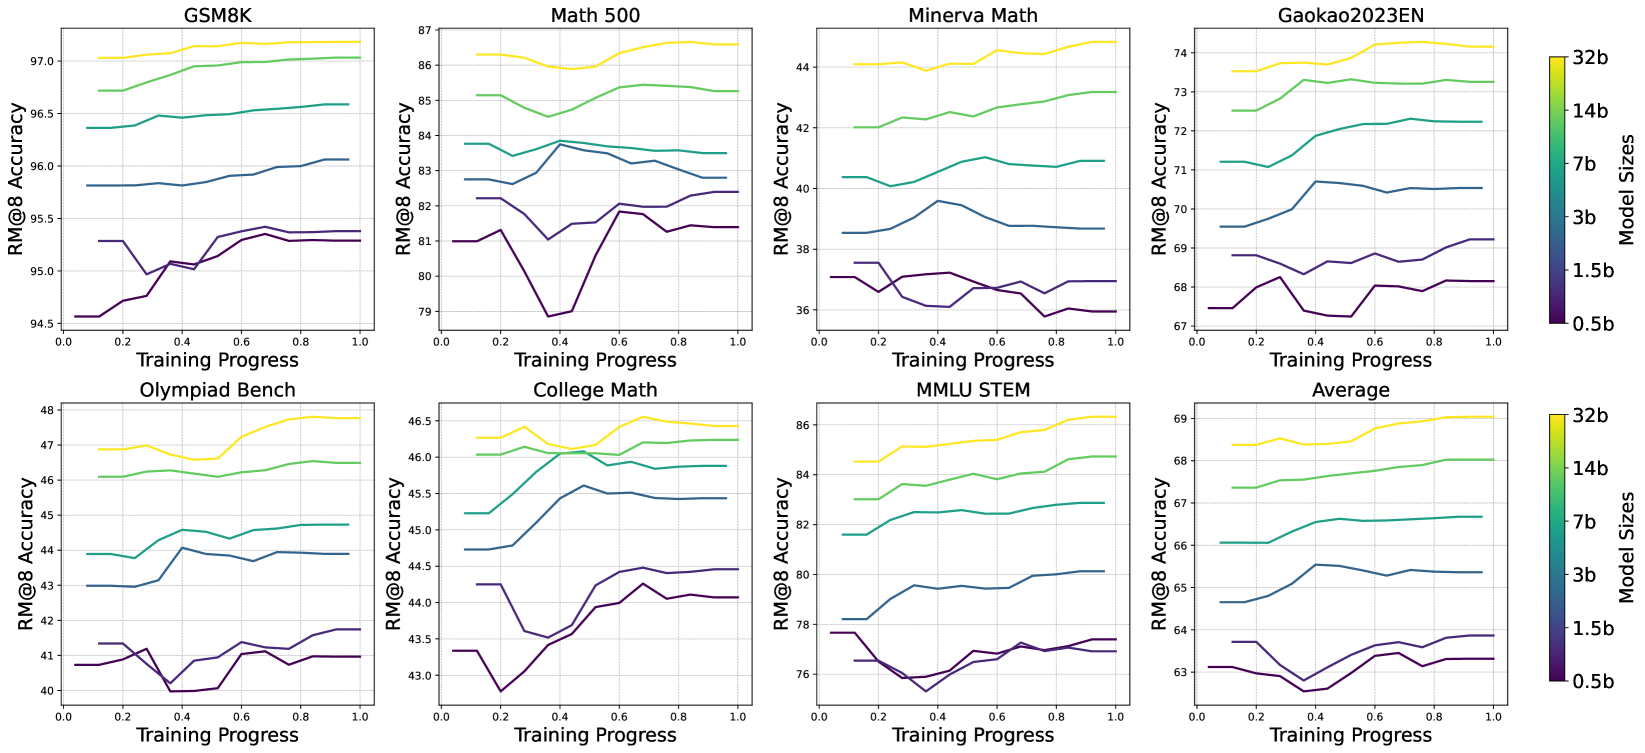
The image presents a series of line charts comparing the RM@8 accuracy of different model sizes (0.5b, 1.5b, 3b, 7b, 14b, 32b) across various training progress levels (0.0 to 1.0) for different datasets. Each chart corresponds to a specific dataset: GSM8K, Math 500, Minerva Math, Gaokao2023EN, Olympiad Bench, College Math, MMLU STEM, and an average across all datasets. The charts share a common legend indicating model sizes by color.
### Components/Axes
* **X-axis (Horizontal):** Training Progress, ranging from 0.0 to 1.0 in increments of 0.2.
* **Y-axis (Vertical):** RM@8 Accuracy, with varying scales depending on the dataset.
* **Titles:** Each chart has a title indicating the dataset name (e.g., "GSM8K", "Math 500").
* **Legend (Right):** A vertical color bar indicating model sizes: 0.5b (dark purple), 1.5b (purple), 3b (dark blue), 7b (teal), 14b (light green), and 32b (yellow).
* **Gridlines:** Each chart has faint grey gridlines to aid in reading values.
### Detailed Analysis
**1. GSM8K**
* Y-axis ranges from 94.5 to 97.0.
* **0.5b (dark purple):** Starts at approximately 94.6, dips slightly, then increases to around 95.3.
* **1.5b (purple):** Starts at approximately 95.3, dips slightly, then increases to around 95.4.
* **3b (dark blue):** Relatively flat at approximately 96.0.
* **7b (teal):** Relatively flat at approximately 96.4.
* **14b (light green):** Relatively flat at approximately 96.7.
* **32b (yellow):** Relatively flat at approximately 97.1.
**2. Math 500**
* Y-axis ranges from 79 to 87.
* **0.5b (dark purple):** Starts at approximately 81.5, dips to 79, then increases to around 82.
* **1.5b (purple):** Starts at approximately 82, dips to 81, then increases to around 82.5.
* **3b (dark blue):** Relatively flat at approximately 83.5.
* **7b (teal):** Relatively flat at approximately 84.
* **14b (light green):** Relatively flat at approximately 85.
* **32b (yellow):** Relatively flat at approximately 86.5.
**3. Minerva Math**
* Y-axis ranges from 36 to 44.
* **0.5b (dark purple):** Starts at approximately 37.5, dips slightly, then increases to around 37.
* **1.5b (purple):** Starts at approximately 37, dips slightly, then increases to around 37.
* **3b (dark blue):** Starts at approximately 38, increases to 40, then decreases to around 39.
* **7b (teal):** Relatively flat at approximately 41.
* **14b (light green):** Relatively flat at approximately 42.5.
* **32b (yellow):** Relatively flat at approximately 44.
**4. Gaokao2023EN**
* Y-axis ranges from 66 to 74.
* **0.5b (dark purple):** Starts at approximately 67.5, increases to 68.5, then decreases to around 68.
* **1.5b (purple):** Starts at approximately 68.5, increases to 69, then decreases to around 68.
* **3b (dark blue):** Starts at approximately 69.5, increases to 70.5, then decreases to around 70.
* **7b (teal):** Starts at approximately 72.5, increases to 73, then decreases to around 72.
* **14b (light green):** Starts at approximately 73, increases to 73.5, then decreases to around 73.
* **32b (yellow):** Relatively flat at approximately 74.
**5. Olympiad Bench**
* Y-axis ranges from 40 to 48.
* **0.5b (dark purple):** Starts at approximately 41.5, dips to 40, then increases to around 41.5.
* **1.5b (purple):** Starts at approximately 43, increases to 44, then decreases to around 44.
* **3b (dark blue):** Relatively flat at approximately 44.5.
* **7b (teal):** Relatively flat at approximately 46.
* **14b (light green):** Relatively flat at approximately 46.5.
* **32b (yellow):** Relatively flat at approximately 48.
**6. College Math**
* Y-axis ranges from 42.5 to 46.5.
* **0.5b (dark purple):** Starts at approximately 43.5, dips to 43, then increases to around 44.5.
* **1.5b (purple):** Starts at approximately 44.5, increases to 45, then decreases to around 45.
* **3b (dark blue):** Relatively flat at approximately 45.5.
* **7b (teal):** Relatively flat at approximately 46.
* **14b (light green):** Relatively flat at approximately 46.
* **32b (yellow):** Relatively flat at approximately 46.5.
**7. MMLU STEM**
* Y-axis ranges from 75 to 87.
* **0.5b (dark purple):** Starts at approximately 78, dips to 76, then increases to around 77.
* **1.5b (purple):** Starts at approximately 78, dips to 76, then increases to around 77.
* **3b (dark blue):** Starts at approximately 78, increases to 80, then decreases to around 80.
* **7b (teal):** Starts at approximately 82, increases to 83, then decreases to around 83.
* **14b (light green):** Starts at approximately 84, increases to 85, then decreases to around 85.
* **32b (yellow):** Starts at approximately 85, increases to 86, then decreases to around 86.
**8. Average**
* Y-axis ranges from 62 to 70.
* **0.5b (dark purple):** Starts at approximately 63, dips to 62.5, then increases to around 63.5.
* **1.5b (purple):** Starts at approximately 63.5, dips to 63, then increases to around 64.
* **3b (dark blue):** Starts at approximately 65, increases to 66, then decreases to around 65.5.
* **7b (teal):** Starts at approximately 67, increases to 68, then decreases to around 67.5.
* **14b (light green):** Starts at approximately 68, increases to 68.5, then decreases to around 68.
* **32b (yellow):** Starts at approximately 68.5, increases to 69, then decreases to around 69.
### Key Observations
* Generally, larger model sizes (32b, 14b) achieve higher RM@8 accuracy compared to smaller models (0.5b, 1.5b) across all datasets.
* The "Average" chart shows a clear separation between model sizes, with larger models consistently outperforming smaller ones.
* The performance difference between model sizes is more pronounced in some datasets (e.g., MMLU STEM) than others (e.g., College Math).
* The initial training progress (0.0 to 0.2) often shows a significant increase in accuracy for smaller models, while larger models tend to be more stable.
* Some datasets (e.g., Math 500, Olympiad Bench) exhibit a dip in accuracy for smaller models around the 0.2 to 0.4 training progress mark.
### Interpretation
The data suggests that increasing model size generally leads to improved performance, as measured by RM@8 accuracy, across a variety of datasets. However, the extent of improvement varies depending on the specific dataset. The initial training phase appears to be more critical for smaller models, as they exhibit more significant fluctuations in accuracy compared to larger models. The observed dips in accuracy for smaller models in certain datasets might indicate overfitting or instability during the early stages of training. The "Average" chart provides a consolidated view, highlighting the overall trend of larger models achieving higher accuracy.
DECODING INTELLIGENCE...
EXPERT: gemini-3.1-flash-lite-preview-free VERSION 1
RUNTIME: google-free/gemini-3.1-flash-lite-preview
INTEL_VERIFIED
## Multi-panel Line Chart: Model Size Scaling Performance on Various Benchmarks
### Overview
The image presents a 2x4 grid of line charts illustrating the relationship between "Training Progress" (x-axis) and "RM@8 Accuracy" (y-axis) across eight different benchmarks. Each chart contains six data series, color-coded by model size, ranging from 0.5b (dark purple) to 32b (yellow). The charts demonstrate how model performance scales with training and parameter size.
### Components/Axes
* **Grid Layout:** 8 charts arranged in two rows of four.
* **X-Axis:** "Training Progress" ranging from 0.0 to 1.0.
* **Y-Axis:** "RM@8 Accuracy" (values vary by specific benchmark).
* **Legend:** Located on the far right (two identical legends for top and bottom rows).
* **Color Scale:**
* Dark Purple: 0.5b
* Dark Blue: 1.5b
* Medium Blue: 3b
* Teal: 7b
* Light Green: 14b
* Yellow: 32b
* **Benchmarks (Charts):**
* **Top Row:** GSM8K, Math 500, Minerva Math, Gaokao2023EN.
* **Bottom Row:** Olympiad Bench, College Math, MMLU STEM, Average.
### Detailed Analysis
The data consistently shows that larger models (yellow/green lines) occupy the top of each chart, while smaller models (purple/blue lines) occupy the bottom.
#### Top Row
1. **GSM8K:**
* **Trend:** All lines show a steady upward slope.
* **Values:** 32b starts at ~97.0% and ends at ~97.2%. 0.5b starts at ~94.6% and ends at ~95.3%.
2. **Math 500:**
* **Trend:** Generally upward, though smaller models (0.5b) exhibit significant volatility, dipping sharply around 0.4 training progress before recovering.
* **Values:** 32b starts at ~86.3% and ends at ~86.6%. 0.5b starts at ~81.0%, dips to ~79.0%, and ends at ~81.4%.
3. **Minerva Math:**
* **Trend:** Upward trend for larger models; smaller models remain relatively flat or slightly declining.
* **Values:** 32b starts at ~44.0% and ends at ~44.8%. 0.5b starts at ~37.0% and ends at ~36.0%.
4. **Gaokao2023EN:**
* **Trend:** Consistent upward trend across all sizes.
* **Values:** 32b starts at ~73.5% and ends at ~74.2%. 0.5b starts at ~67.5% and ends at ~68.2%.
#### Bottom Row
5. **Olympiad Bench:**
* **Trend:** Upward trend.
* **Values:** 32b starts at ~46.8% and ends at ~47.8%. 0.5b starts at ~40.8% and ends at ~41.0%.
6. **College Math:**
* **Trend:** Upward trend.
* **Values:** 32b starts at ~46.2% and ends at ~46.4%. 0.5b starts at ~43.3% and ends at ~44.1%.
7. **MMLU STEM:**
* **Trend:** Upward trend for larger models; smaller models show a slight dip mid-training.
* **Values:** 32b starts at ~84.5% and ends at ~86.5%. 0.5b starts at ~77.5% and ends at ~77.5%.
8. **Average:**
* **Trend:** Smooth, consistent upward trend across all model sizes.
* **Values:** 32b starts at ~68.3% and ends at ~69.0%. 0.5b starts at ~63.1% and ends at ~63.8%.
### Key Observations
* **Scaling Law:** There is a clear, positive correlation between model size and accuracy. In every single benchmark, the 32b model (yellow) is the top performer, and the 0.5b model (dark purple) is the lowest performer.
* **Training Stability:** Larger models exhibit smoother learning curves. Smaller models, particularly in "Math 500" and "MMLU STEM," show more erratic behavior (dips and plateaus) during the training process.
* **Performance Gap:** The gap between the smallest (0.5b) and largest (32b) models is significant and persistent across all benchmarks, indicating that parameter count is a primary driver of performance in these tasks.
### Interpretation
This visualization provides a textbook example of **scaling laws** in machine learning. The data demonstrates that increasing the parameter count of a model consistently yields higher accuracy across a diverse set of mathematical and STEM-focused benchmarks.
The "Average" chart is particularly telling; it smooths out the noise present in individual benchmarks, confirming that the training process is effective and that the performance gains are not artifacts of a specific dataset but a general property of the model scaling. The volatility observed in smaller models suggests they may be more sensitive to the training process or lack the capacity to generalize as effectively as the larger models, leading to less stable learning trajectories.
DECODING INTELLIGENCE...
EXPERT: jina-vlm VERSION 2
RUNTIME: jina-vlm
INTEL_VERIFIED
## Heatmap: Model Accuracy Over Training Progress
### Overview
The heatmap displays the accuracy of various models (GSM8K, Math 500, Minerva Math, Gaokao2023EN, Olympiad Bench, College Math, MMMLU STEM, Average) over different training progress stages. The color gradient represents the model size, with darker shades indicating larger models.
### Components/Axes
- **X-axis**: Training Progress (ranging from 0 to 1)
- **Y-axis**: Model Size (ranging from 0.5b to 32b)
- **Color Gradient**: Darker shades indicate larger models
- **Legend**: Color legend on the right side, indicating model sizes
- **Data Series**: Each row represents a different model, with columns showing accuracy at various training progress stages
### Detailed Analysis or ### Content Details
- **GSM8K**: Shows a general trend of increasing accuracy as training progresses, with the largest model (32b) maintaining the highest accuracy throughout.
- **Math 500**: Displays a similar trend, with the largest model consistently achieving the highest accuracy.
- **Minerva Math**: Shows a slight decrease in accuracy at the beginning of training, followed by an increase as training progresses. The largest model maintains a high accuracy level.
- **Gaokao2023EN**: Exhibits a steady increase in accuracy with training, with the largest model maintaining the highest accuracy.
- **Olympiad Bench**: Shows a gradual increase in accuracy, with the largest model maintaining the highest accuracy.
- **College Math**: Displays a slight decrease in accuracy at the beginning of training, followed by an increase as training progresses. The largest model maintains a high accuracy level.
- **MMMLU STEM**: Shows a steady increase in accuracy with training, with the largest model maintaining the highest accuracy.
- **Average**: Represents the average accuracy across all models and training progress stages. The largest model maintains the highest average accuracy.
### Key Observations
- The largest model consistently achieves the highest accuracy across all models and training progress stages.
- There is a general trend of increasing accuracy as training progresses for most models.
- The accuracy of smaller models (0.5b to 1.5b) tends to be lower than that of larger models (32b).
### Interpretation
The data suggests that larger models tend to maintain higher accuracy throughout the training process. This could be due to the increased computational resources and capacity of larger models, allowing them to learn more complex patterns and representations. The slight decrease in accuracy for smaller models at the beginning of training could be attributed to the initial learning phase where smaller models may not have enough capacity to learn the underlying patterns. However, as training progresses, the larger models are able to maintain and even improve their accuracy, indicating that they are better suited for the task at hand.
DECODING INTELLIGENCE...
EXPERT: nemotron-free VERSION 1
RUNTIME: free/nvidia/nemotron-nano-12b-v2-vl:free
INTEL_VERIFIED
## Line Graphs: Model Accuracy Across Datasets and Model Sizes
### Overview
The image contains eight line graphs comparing model accuracy (RM@8) across different datasets (GSM8K, Math 500, Minerva Math, Gaokao2023EN, Olympiad Bench, College Math, MMLU STEM, and Average) as training progresses from 0.0 to 1.0. Each graph includes four data series representing model sizes (0.5b, 1.5b, 3b, 7b, 14b, 32b), with colors mapped to sizes via a legend. Both y-axes are labeled "RM@8 Accuracy," though the right axis appears redundant.
---
### Components/Axes
- **X-Axis**: Training Progress (0.0 to 1.0 in increments of 0.2).
- **Y-Axes**:
- Left: RM@8 Accuracy (ranges vary by dataset, e.g., 94.5–97.5 for GSM8K).
- Right: RM@8 Accuracy (same scale as left, likely a duplication).
- **Legend**: Located on the right, with colors corresponding to model sizes:
- Yellow: 32b
- Green: 14b
- Blue: 3b
- Purple: 0.5b
- **Datasets**: Each graph is titled with a dataset name (e.g., "GSM8K," "Math 500").
---
### Detailed Analysis
#### GSM8K
- **32b (Yellow)**: Starts at ~97.0, increases steadily to ~97.5.
- **14b (Green)**: Starts at ~96.5, rises to ~97.0.
- **3b (Blue)**: Starts at ~95.8, increases to ~96.0.
- **0.5b (Purple)**: Starts at ~94.5, dips to ~94.8 at 0.4, then rises to ~95.3.
#### Math 500
- **32b (Yellow)**: Peaks at ~86.5, then stabilizes.
- **14b (Green)**: Starts at ~85.0, rises to ~85.5.
- **3b (Blue)**: Fluctuates between ~82.5 and ~83.5.
- **0.5b (Purple)**: Drops to ~79.0 at 0.2, recovers to ~81.0.
#### Minerva Math
- **32b (Yellow)**: Starts at ~44.0, rises to ~44.5.
- **14b (Green)**: Starts at ~42.0, increases to ~42.5.
- **3b (Blue)**: Starts at ~40.0, rises to ~40.5.
- **0.5b (Purple)**: Dips to ~36.0 at 0.2, recovers to ~38.0.
#### Gaokao2023EN
- **32b (Yellow)**: Starts at ~73.0, rises to ~74.0.
- **14b (Green)**: Starts at ~72.0, increases to ~72.5.
- **3b (Blue)**: Starts at ~70.0, rises to ~70.5.
- **0.5b (Purple)**: Dips to ~67.0 at 0.2, recovers to ~68.0.
#### Olympiad Bench
- **32b (Yellow)**: Starts at ~47.0, rises to ~48.0.
- **14b (Green)**: Starts at ~46.0, increases to ~46.5.
- **3b (Blue)**: Starts at ~43.0, rises to ~44.0.
- **0.5b (Purple)**: Dips to ~40.0 at 0.2, recovers to ~41.0.
#### College Math
- **32b (Yellow)**: Starts at ~46.0, rises to ~46.5.
- **14b (Green)**: Starts at ~45.0, increases to ~45.5.
- **3b (Blue)**: Starts at ~44.0, rises to ~44.5.
- **0.5b (Purple)**: Dips to ~43.0 at 0.2, recovers to ~44.0.
#### MMLU STEM
- **32b (Yellow)**: Starts at ~68.0, rises to ~69.0.
- **14b (Green)**: Starts at ~67.0, increases to ~67.5.
- **3b (Blue)**: Starts at ~65.0, rises to ~65.5.
- **0.5b (Purple)**: Dips to ~63.0 at 0.2, recovers to ~64.0.
#### Average
- **32b (Yellow)**: Starts at ~68.0, rises to ~69.0.
- **14b (Green)**: Starts at ~67.0, increases to ~67.5.
- **3b (Blue)**: Starts at ~65.0, rises to ~65.5.
- **0.5b (Purple)**: Dips to ~63.0 at 0.2, recovers to ~64.0.
---
### Key Observations
1. **Model Size Correlation**: Larger models (32b, 14b) consistently achieve higher RM@8 accuracy across all datasets.
2. **Training Instability**: Smaller models (0.5b, 1.5b) exhibit dips in accuracy during early training (e.g., 0.2–0.4 progress).
3. **Dataset Variability**:
- GSM8K and Olympiad Bench show the highest accuracy gains.
- Math 500 and Gaokao2023EN exhibit more volatility in smaller models.
4. **Average Trend**: The "Average" graph mirrors individual dataset trends, confirming consistency across tasks.
---
### Interpretation
- **Performance Scaling**: Larger models (32b, 14b) demonstrate superior accuracy, suggesting that parameter count correlates with task performance.
- **Training Dynamics**: Smaller models (0.5b, 1.5b) experience instability during early training, potentially due to optimization challenges or data scarcity.
- **Dataset-Specific Behavior**: Tasks like GSM8K and Olympiad Bench may require higher model capacity, while others (e.g., Math 500) show mixed results, indicating task-dependent scaling laws.
- **Redundant Y-Axis**: The duplicated "RM@8 Accuracy" labels on both axes suggest a possible visualization error, though the data remains interpretable.
This analysis highlights the importance of model size in achieving accuracy and underscores the need for stable training protocols, particularly for smaller models.
DECODING INTELLIGENCE...