## Multi-panel Line Chart: Model Size Scaling Performance on Various Benchmarks
### Overview
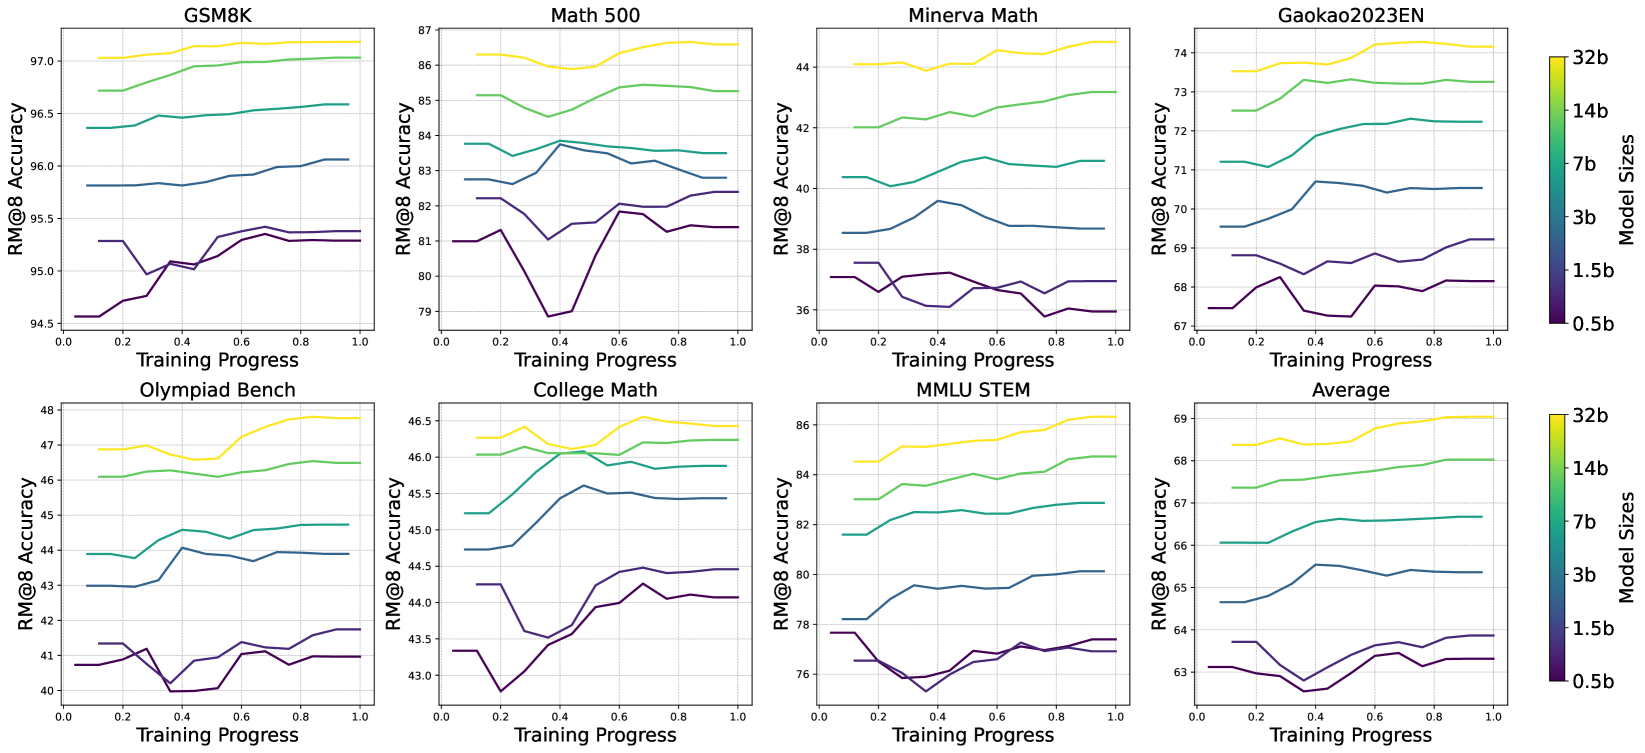
The image presents a 2x4 grid of line charts illustrating the relationship between "Training Progress" (x-axis) and "RM@8 Accuracy" (y-axis) across eight different benchmarks. Each chart contains six data series, color-coded by model size, ranging from 0.5b (dark purple) to 32b (yellow). The charts demonstrate how model performance scales with training and parameter size.
### Components/Axes
* **Grid Layout:** 8 charts arranged in two rows of four.
* **X-Axis:** "Training Progress" ranging from 0.0 to 1.0.
* **Y-Axis:** "RM@8 Accuracy" (values vary by specific benchmark).
* **Legend:** Located on the far right (two identical legends for top and bottom rows).
* **Color Scale:**
* Dark Purple: 0.5b
* Dark Blue: 1.5b
* Medium Blue: 3b
* Teal: 7b
* Light Green: 14b
* Yellow: 32b
* **Benchmarks (Charts):**
* **Top Row:** GSM8K, Math 500, Minerva Math, Gaokao2023EN.
* **Bottom Row:** Olympiad Bench, College Math, MMLU STEM, Average.
### Detailed Analysis
The data consistently shows that larger models (yellow/green lines) occupy the top of each chart, while smaller models (purple/blue lines) occupy the bottom.
#### Top Row
1. **GSM8K:**
* **Trend:** All lines show a steady upward slope.
* **Values:** 32b starts at ~97.0% and ends at ~97.2%. 0.5b starts at ~94.6% and ends at ~95.3%.
2. **Math 500:**
* **Trend:** Generally upward, though smaller models (0.5b) exhibit significant volatility, dipping sharply around 0.4 training progress before recovering.
* **Values:** 32b starts at ~86.3% and ends at ~86.6%. 0.5b starts at ~81.0%, dips to ~79.0%, and ends at ~81.4%.
3. **Minerva Math:**
* **Trend:** Upward trend for larger models; smaller models remain relatively flat or slightly declining.
* **Values:** 32b starts at ~44.0% and ends at ~44.8%. 0.5b starts at ~37.0% and ends at ~36.0%.
4. **Gaokao2023EN:**
* **Trend:** Consistent upward trend across all sizes.
* **Values:** 32b starts at ~73.5% and ends at ~74.2%. 0.5b starts at ~67.5% and ends at ~68.2%.
#### Bottom Row
5. **Olympiad Bench:**
* **Trend:** Upward trend.
* **Values:** 32b starts at ~46.8% and ends at ~47.8%. 0.5b starts at ~40.8% and ends at ~41.0%.
6. **College Math:**
* **Trend:** Upward trend.
* **Values:** 32b starts at ~46.2% and ends at ~46.4%. 0.5b starts at ~43.3% and ends at ~44.1%.
7. **MMLU STEM:**
* **Trend:** Upward trend for larger models; smaller models show a slight dip mid-training.
* **Values:** 32b starts at ~84.5% and ends at ~86.5%. 0.5b starts at ~77.5% and ends at ~77.5%.
8. **Average:**
* **Trend:** Smooth, consistent upward trend across all model sizes.
* **Values:** 32b starts at ~68.3% and ends at ~69.0%. 0.5b starts at ~63.1% and ends at ~63.8%.
### Key Observations
* **Scaling Law:** There is a clear, positive correlation between model size and accuracy. In every single benchmark, the 32b model (yellow) is the top performer, and the 0.5b model (dark purple) is the lowest performer.
* **Training Stability:** Larger models exhibit smoother learning curves. Smaller models, particularly in "Math 500" and "MMLU STEM," show more erratic behavior (dips and plateaus) during the training process.
* **Performance Gap:** The gap between the smallest (0.5b) and largest (32b) models is significant and persistent across all benchmarks, indicating that parameter count is a primary driver of performance in these tasks.
### Interpretation
This visualization provides a textbook example of **scaling laws** in machine learning. The data demonstrates that increasing the parameter count of a model consistently yields higher accuracy across a diverse set of mathematical and STEM-focused benchmarks.
The "Average" chart is particularly telling; it smooths out the noise present in individual benchmarks, confirming that the training process is effective and that the performance gains are not artifacts of a specific dataset but a general property of the model scaling. The volatility observed in smaller models suggests they may be more sensitive to the training process or lack the capacity to generalize as effectively as the larger models, leading to less stable learning trajectories.