TECHNICAL ASSET FINGERPRINT
85070eb8dcaed1f192c44ff6
Click to view fullscreen
Press ESC or click to close
FOUND IN PAPERS
EXPERT: gemma-3-27b-it-free VERSION 1
RUNTIME: google-free/gemma-3-27b-it
INTEL_VERIFIED
## Charts: Model Performance vs. Training Progress
### Overview
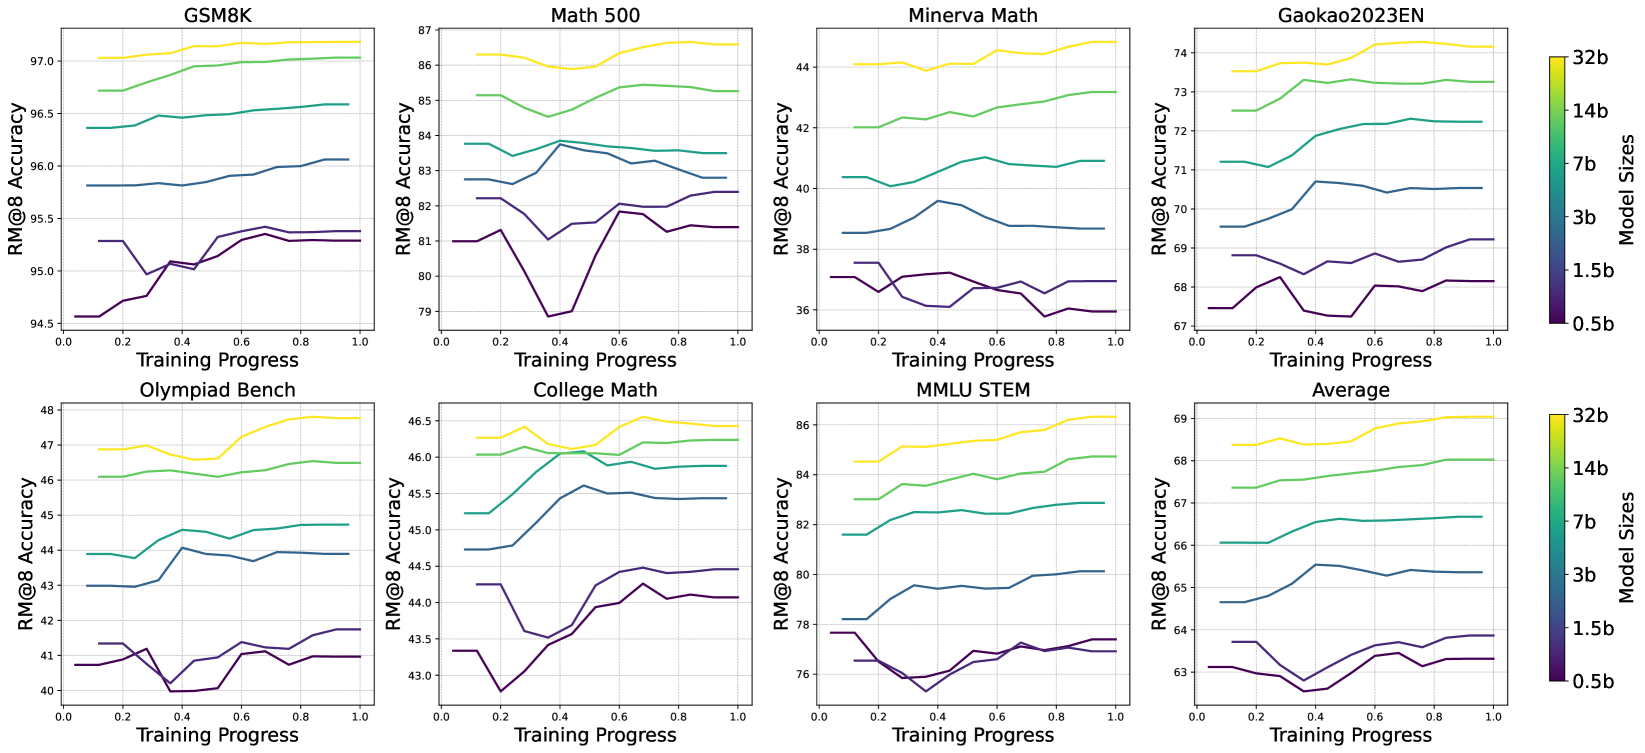
The image presents a 3x4 grid of line charts, each depicting the relationship between RM@8 Accuracy and Training Progress for different datasets and model sizes. The charts compare the performance of models with varying numbers of parameters (0.5b, 1.5b, 3b, 7b, 14b, and 32b) as they are trained. The datasets include GSM8K, Math 500, Minerva Math, Gaokao2023EN, Olympiad Bench, College Math, MMLU STEM, and an Average across all datasets.
### Components/Axes
* **X-axis:** Training Progress, ranging from 0.0 to 1.0.
* **Y-axis:** RM@8 Accuracy, with varying scales depending on the dataset.
* GSM8K: 94.5 to 97.0
* Math 500: 79 to 87
* Minerva Math: 36 to 44
* Gaokao2023EN: 67 to 74
* Olympiad Bench: 40 to 48
* College Math: 43 to 46.5
* MMLU STEM: 76 to 86
* Average: 63 to 69
* **Legend:** Located on the right side of the image, indicating model sizes with corresponding colors:
* 32b (Dark Blue)
* 14b (Light Blue)
* 7b (Green)
* 3b (Red)
* 1.5b (Orange)
* 0.5b (Purple)
### Detailed Analysis or Content Details
**GSM8K:**
* The 32b model (Dark Blue) shows a slight upward trend, starting around 96.2 and ending around 96.8.
* The 14b model (Light Blue) starts around 95.8 and ends around 96.5, showing a moderate upward trend.
* The 7b model (Green) starts around 95.5 and ends around 96.2, with a slight upward trend.
* The 3b model (Red) starts around 95.2 and ends around 95.8, with a minimal upward trend.
* The 1.5b model (Orange) starts around 94.8 and ends around 95.3, with a slight upward trend.
* The 0.5b model (Purple) starts around 94.5 and ends around 95.0, with a minimal upward trend.
**Math 500:**
* The 32b model (Dark Blue) shows a slight downward trend, starting around 86.5 and ending around 85.5.
* The 14b model (Light Blue) shows a downward trend, starting around 85.0 and ending around 83.5.
* The 7b model (Green) shows a downward trend, starting around 84.0 and ending around 82.0.
* The 3b model (Red) shows a downward trend, starting around 83.0 and ending around 80.5.
* The 1.5b model (Orange) shows a downward trend, starting around 82.0 and ending around 79.5.
* The 0.5b model (Purple) shows a downward trend, starting around 81.0 and ending around 79.0.
**Minerva Math:**
* The 32b model (Dark Blue) shows a slight upward trend, starting around 41.5 and ending around 42.5.
* The 14b model (Light Blue) shows a slight upward trend, starting around 40.5 and ending around 41.5.
* The 7b model (Green) shows a slight upward trend, starting around 39.5 and ending around 40.5.
* The 3b model (Red) shows a slight upward trend, starting around 38.5 and ending around 39.5.
* The 1.5b model (Orange) shows a slight upward trend, starting around 37.5 and ending around 38.5.
* The 0.5b model (Purple) shows a slight upward trend, starting around 36.5 and ending around 37.5.
**Gaokao2023EN:**
* The 32b model (Dark Blue) shows a slight upward trend, starting around 72.5 and ending around 73.5.
* The 14b model (Light Blue) shows a slight upward trend, starting around 71.5 and ending around 72.5.
* The 7b model (Green) shows a slight upward trend, starting around 70.5 and ending around 71.5.
* The 3b model (Red) shows a slight upward trend, starting around 69.5 and ending around 70.5.
* The 1.5b model (Orange) shows a slight upward trend, starting around 68.5 and ending around 69.5.
* The 0.5b model (Purple) shows a slight upward trend, starting around 67.5 and ending around 68.5.
**Olympiad Bench:**
* The 32b model (Dark Blue) shows a slight upward trend, starting around 45.5 and ending around 46.5.
* The 14b model (Light Blue) shows a slight upward trend, starting around 44.5 and ending around 45.5.
* The 7b model (Green) shows a slight upward trend, starting around 43.5 and ending around 44.5.
* The 3b model (Red) shows a slight upward trend, starting around 42.5 and ending around 43.5.
* The 1.5b model (Orange) shows a slight upward trend, starting around 41.5 and ending around 42.5.
* The 0.5b model (Purple) shows a slight upward trend, starting around 40.5 and ending around 41.5.
**College Math:**
* The 32b model (Dark Blue) shows a slight upward trend, starting around 45.5 and ending around 46.0.
* The 14b model (Light Blue) shows a slight upward trend, starting around 44.5 and ending around 45.0.
* The 7b model (Green) shows a slight upward trend, starting around 43.5 and ending around 44.0.
* The 3b model (Red) shows a slight upward trend, starting around 42.5 and ending around 43.0.
* The 1.5b model (Orange) shows a slight upward trend, starting around 41.5 and ending around 42.0.
* The 0.5b model (Purple) shows a slight upward trend, starting around 40.5 and ending around 41.0.
**MMLU STEM:**
* The 32b model (Dark Blue) shows a slight upward trend, starting around 82.5 and ending around 83.5.
* The 14b model (Light Blue) shows a slight upward trend, starting around 81.5 and ending around 82.5.
* The 7b model (Green) shows a slight upward trend, starting around 80.5 and ending around 81.5.
* The 3b model (Red) shows a slight upward trend, starting around 79.5 and ending around 80.5.
* The 1.5b model (Orange) shows a slight upward trend, starting around 78.5 and ending around 79.5.
* The 0.5b model (Purple) shows a slight upward trend, starting around 76.5 and ending around 77.5.
**Average:**
* The 32b model (Dark Blue) shows a slight upward trend, starting around 66.5 and ending around 67.5.
* The 14b model (Light Blue) shows a slight upward trend, starting around 65.5 and ending around 66.5.
* The 7b model (Green) shows a slight upward trend, starting around 64.5 and ending around 65.5.
* The 3b model (Red) shows a slight upward trend, starting around 63.5 and ending around 64.5.
* The 1.5b model (Orange) shows a slight upward trend, starting around 63.0 and ending around 64.0.
* The 0.5b model (Purple) shows a slight upward trend, starting around 62.5 and ending around 63.5.
### Key Observations
* Generally, larger models (32b, 14b) exhibit slightly higher accuracy than smaller models (0.5b, 1.5b) across most datasets.
* The Math 500 dataset shows a consistent downward trend in accuracy for all model sizes, suggesting potential difficulties in this domain.
* The Minerva Math dataset shows the lowest overall accuracy levels, indicating a challenging task.
* The GSM8K dataset shows the highest overall accuracy levels.
* The accuracy improvements across training progress are generally small, suggesting diminishing returns.
### Interpretation
The charts demonstrate the performance of language models of varying sizes on a range of tasks. The consistent trend of larger models outperforming smaller models highlights the benefits of increased model capacity. However, the relatively small accuracy gains with increased training progress suggest that the models may be approaching their performance limits or that the training data is not sufficiently diverse or challenging. The downward trend observed in the Math 500 dataset indicates that this task is particularly difficult for these models, potentially requiring specialized architectures or training techniques. The differences in performance across datasets suggest that the models' capabilities vary depending on the nature of the task. The average chart provides a consolidated view of performance, showing that even the largest models have room for improvement. The data suggests that scaling model size is a viable strategy for improving performance, but it is not a panacea, and further research is needed to address the challenges posed by specific tasks like Math 500.
DECODING INTELLIGENCE...