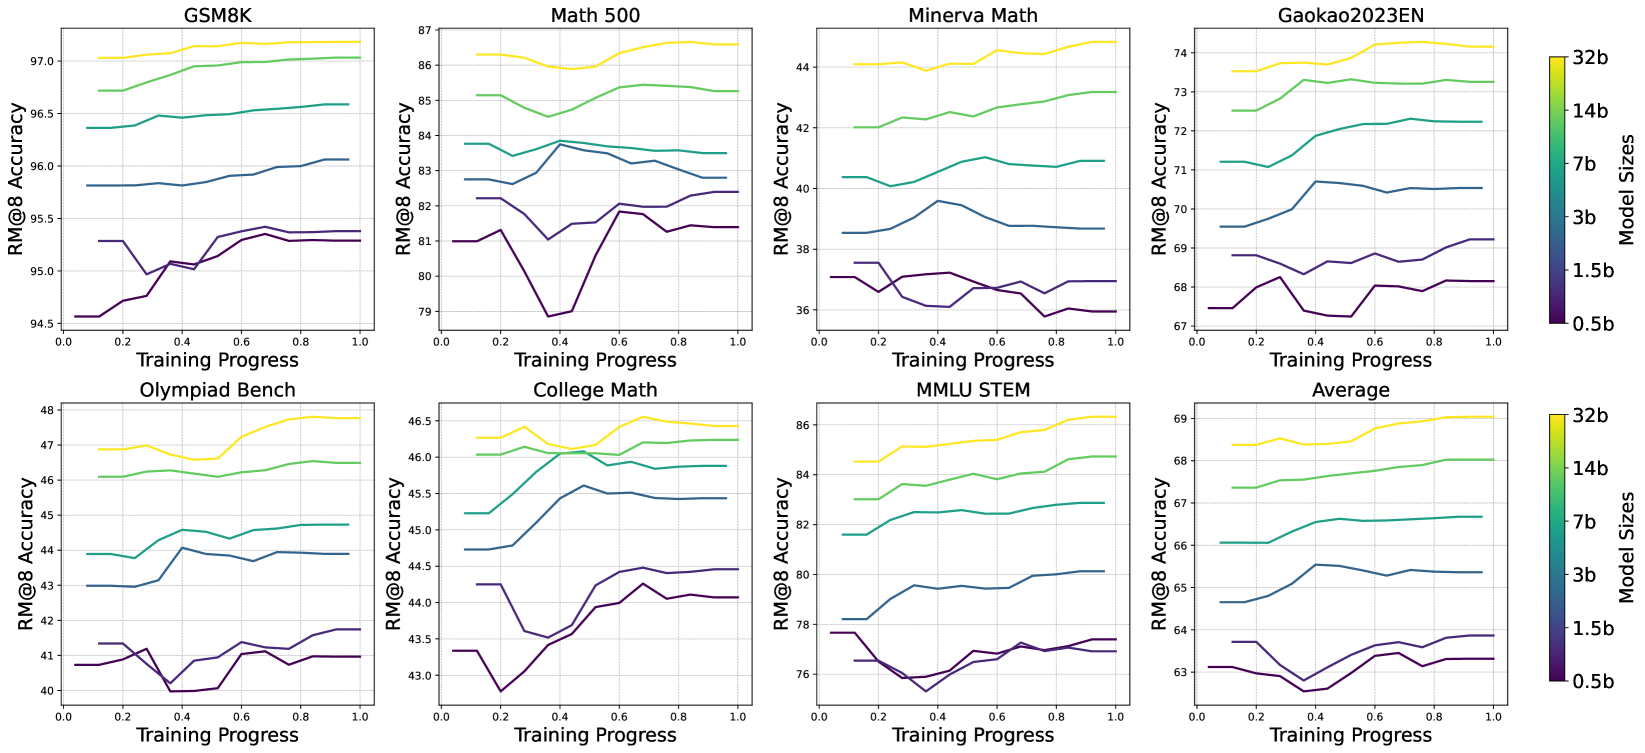
## Multi-Chart Performance Analysis: Model Size vs. Training Progress
### Overview
The image displays a grid of eight line charts arranged in two rows of four. Each chart plots the performance of different-sized language models on a specific benchmark as a function of training progress. The overall visualization compares how model scale (from 0.5 billion to 32 billion parameters) affects learning trajectories across diverse mathematical and reasoning tasks.
### Components/Axes
* **Chart Grid:** 8 individual line charts.
* **Chart Titles (Top Row, Left to Right):** `GSM8K`, `Math 500`, `Minerva Math`, `Gaokao2023EN`.
* **Chart Titles (Bottom Row, Left to Right):** `Olympiad Bench`, `College Math`, `MMLU STEM`, `Average`.
* **X-Axis (All Charts):** Labeled `Training Progress`. Scale ranges from `0.0` to `1.0` with major ticks at 0.0, 0.2, 0.4, 0.6, 0.8, 1.0.
* **Y-Axis (All Charts):** Labeled `RM@8 Accuracy`. The scale varies per chart to fit the data range.
* **Legend (Right Side, Vertical):** A color bar titled `Model Sizes`. It maps colors to model parameter counts:
* Yellow: `32b`
* Light Green: `14b`
* Teal/Green: `7b`
* Blue: `3b`
* Dark Blue: `1.5b`
* Dark Purple: `0.5b`
### Detailed Analysis
**Trend Verification & Data Points (Approximate Values):**
**Top Row Charts:**
1. **GSM8K:**
* **Y-Axis Range:** ~94.5 to 97.0.
* **Trends:** All models show a general upward trend. The 32b model (yellow) starts highest (~97.0) and ends slightly higher. The 0.5b model (purple) starts lowest (~94.5) and shows the most volatility, with a dip around progress 0.3 before recovering.
2. **Math 500:**
* **Y-Axis Range:** ~79 to 87.
* **Trends:** Clear stratification by model size. The 32b model leads (~86.5 start, ~87.0 end). The 0.5b model shows a significant dip to ~79.0 at progress 0.4 before recovering to ~81.5.
3. **Minerva Math:**
* **Y-Axis Range:** ~36 to 44.
* **Trends:** High volatility, especially for smaller models. The 32b model is relatively stable at the top (~44.0). The 0.5b model fluctuates between ~36.0 and ~38.0.
4. **Gaokao2023EN:**
* **Y-Axis Range:** ~67 to 74.
* **Trends:** Steady, stratified improvement. The 32b model starts at ~73.5 and ends near ~74.0. The 0.5b model starts at ~67.5 and ends near ~68.0.
**Bottom Row Charts:**
5. **Olympiad Bench:**
* **Y-Axis Range:** ~40 to 48.
* **Trends:** The 32b model shows a strong upward trend from ~47.0 to ~48.0. The 0.5b model is volatile, dipping to ~40.0 at progress 0.4 before rising to ~41.5.
6. **College Math:**
* **Y-Axis Range:** ~43.0 to 46.5.
* **Trends:** Tight clustering in the middle. The 32b model leads (~46.3 start, ~46.4 end). The 0.5b model dips to ~42.8 at progress 0.2.
7. **MMLU STEM:**
* **Y-Axis Range:** ~76 to 86.
* **Trends:** Clear, consistent stratification. The 32b model improves from ~84.5 to ~86.0. The 0.5b model fluctuates between ~76.0 and ~77.5.
8. **Average:**
* **Y-Axis Range:** ~63 to 69.
* **Trends:** Summarizes the overall pattern. Performance improves with both training progress and model size. The 32b model averages from ~68.5 to ~69.0. The 0.5b model averages from ~63.0 to ~63.5.
### Key Observations
1. **Consistent Hierarchy:** In every single chart, the performance order by model size is perfectly maintained throughout training: 32b > 14b > 7b > 3b > 1.5b > 0.5b. There are no crossovers.
2. **Volatility vs. Scale:** Smaller models (0.5b, 1.5b) exhibit significantly more performance volatility (sharp dips and recoveries) during training compared to larger models, which show smoother, more monotonic improvement curves.
3. **Benchmark Difficulty:** The absolute accuracy ranges reveal benchmark difficulty. `Minerva Math` and `Olympiad Bench` are the most challenging (lowest max accuracy ~44 and ~48), while `GSM8K` and `MMLU STEM` are the easiest (highest max accuracy ~97 and ~86).
4. **Training Progress Impact:** All models show net positive improvement from progress 0.0 to 1.0 across all benchmarks, confirming effective learning.
### Interpretation
This visualization provides strong empirical evidence for two fundamental principles in modern AI scaling:
1. **The Scaling Law in Action:** The perfect, persistent stratification of performance by model size across eight diverse benchmarks demonstrates that increasing parameter count is a reliable, predictable method for improving task performance. The "Average" chart crystallizes this, showing a clean, tiered progression.
2. **Training Stability Scales with Size:** The pronounced volatility in smaller models suggests they are more sensitive to the training process—perhaps more susceptible to optimization challenges, data ordering, or temporary overfitting. Larger models appear more robust, learning in a smoother, more stable manner. This implies that scaling not only improves final performance but also the reliability of the training trajectory.
3. **Benchmark-Specific Learning Profiles:** While the hierarchy is constant, the shape of the learning curves differs. Benchmarks like `Minerva Math` show high volatility for all but the largest models, indicating a complex task where smaller models struggle to find a stable solution. In contrast, `Gaokao2023EN` shows smooth, parallel learning curves, suggesting a more straightforward skill acquisition process.
**Conclusion:** The data argues that for these mathematical and reasoning tasks, model scale is the dominant factor determining both the absolute performance ceiling and the stability of the learning process. The charts serve as a technical reference for predicting model behavior and selecting an appropriate scale for a desired performance level and training stability requirement.