## Line Graphs: Model Accuracy Across Datasets and Model Sizes
### Overview
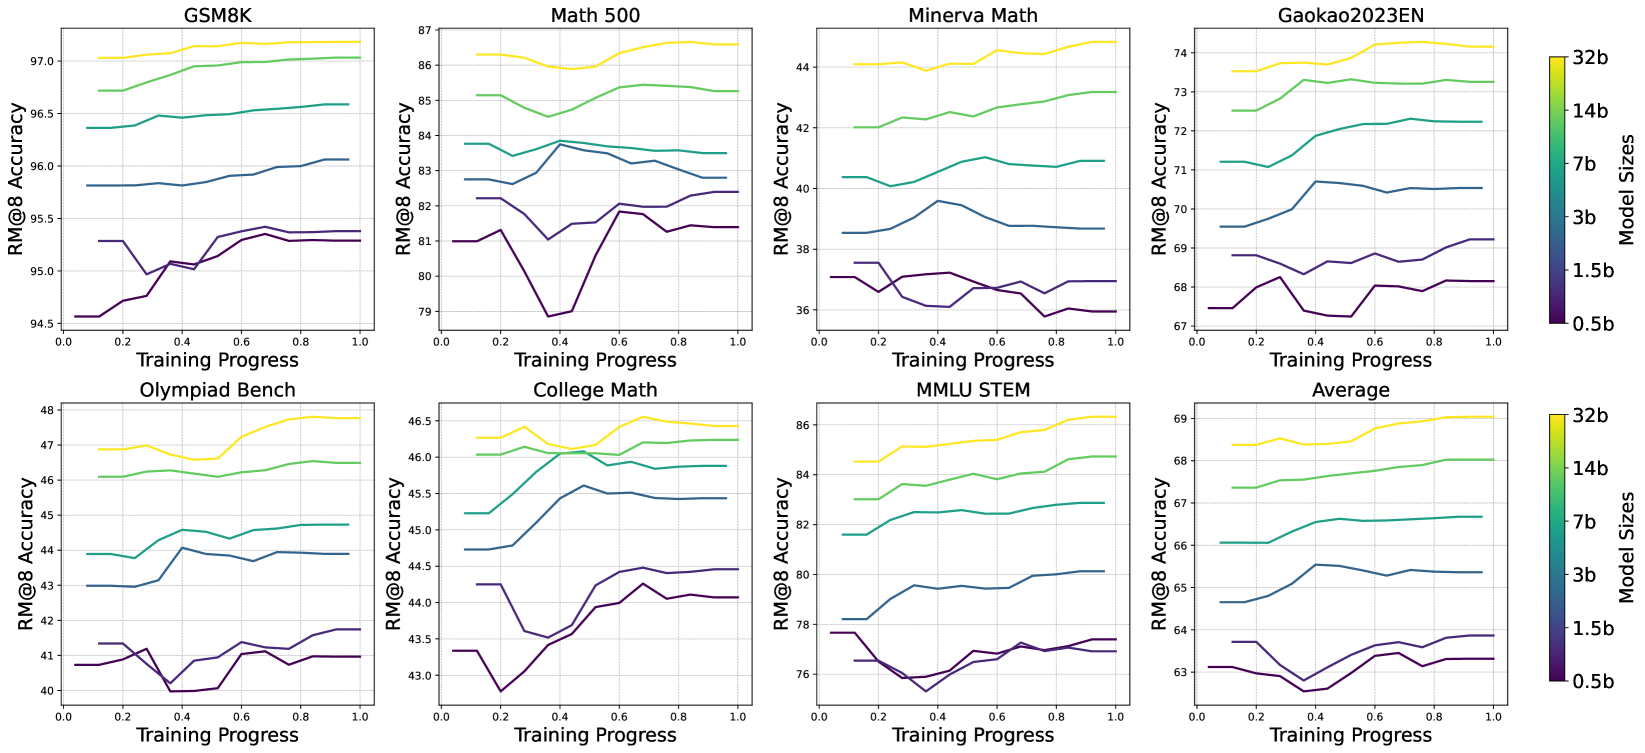
The image contains eight line graphs comparing model accuracy (RM@8) across different datasets (GSM8K, Math 500, Minerva Math, Gaokao2023EN, Olympiad Bench, College Math, MMLU STEM, and Average) as training progresses from 0.0 to 1.0. Each graph includes four data series representing model sizes (0.5b, 1.5b, 3b, 7b, 14b, 32b), with colors mapped to sizes via a legend. Both y-axes are labeled "RM@8 Accuracy," though the right axis appears redundant.
---
### Components/Axes
- **X-Axis**: Training Progress (0.0 to 1.0 in increments of 0.2).
- **Y-Axes**:
- Left: RM@8 Accuracy (ranges vary by dataset, e.g., 94.5–97.5 for GSM8K).
- Right: RM@8 Accuracy (same scale as left, likely a duplication).
- **Legend**: Located on the right, with colors corresponding to model sizes:
- Yellow: 32b
- Green: 14b
- Blue: 3b
- Purple: 0.5b
- **Datasets**: Each graph is titled with a dataset name (e.g., "GSM8K," "Math 500").
---
### Detailed Analysis
#### GSM8K
- **32b (Yellow)**: Starts at ~97.0, increases steadily to ~97.5.
- **14b (Green)**: Starts at ~96.5, rises to ~97.0.
- **3b (Blue)**: Starts at ~95.8, increases to ~96.0.
- **0.5b (Purple)**: Starts at ~94.5, dips to ~94.8 at 0.4, then rises to ~95.3.
#### Math 500
- **32b (Yellow)**: Peaks at ~86.5, then stabilizes.
- **14b (Green)**: Starts at ~85.0, rises to ~85.5.
- **3b (Blue)**: Fluctuates between ~82.5 and ~83.5.
- **0.5b (Purple)**: Drops to ~79.0 at 0.2, recovers to ~81.0.
#### Minerva Math
- **32b (Yellow)**: Starts at ~44.0, rises to ~44.5.
- **14b (Green)**: Starts at ~42.0, increases to ~42.5.
- **3b (Blue)**: Starts at ~40.0, rises to ~40.5.
- **0.5b (Purple)**: Dips to ~36.0 at 0.2, recovers to ~38.0.
#### Gaokao2023EN
- **32b (Yellow)**: Starts at ~73.0, rises to ~74.0.
- **14b (Green)**: Starts at ~72.0, increases to ~72.5.
- **3b (Blue)**: Starts at ~70.0, rises to ~70.5.
- **0.5b (Purple)**: Dips to ~67.0 at 0.2, recovers to ~68.0.
#### Olympiad Bench
- **32b (Yellow)**: Starts at ~47.0, rises to ~48.0.
- **14b (Green)**: Starts at ~46.0, increases to ~46.5.
- **3b (Blue)**: Starts at ~43.0, rises to ~44.0.
- **0.5b (Purple)**: Dips to ~40.0 at 0.2, recovers to ~41.0.
#### College Math
- **32b (Yellow)**: Starts at ~46.0, rises to ~46.5.
- **14b (Green)**: Starts at ~45.0, increases to ~45.5.
- **3b (Blue)**: Starts at ~44.0, rises to ~44.5.
- **0.5b (Purple)**: Dips to ~43.0 at 0.2, recovers to ~44.0.
#### MMLU STEM
- **32b (Yellow)**: Starts at ~68.0, rises to ~69.0.
- **14b (Green)**: Starts at ~67.0, increases to ~67.5.
- **3b (Blue)**: Starts at ~65.0, rises to ~65.5.
- **0.5b (Purple)**: Dips to ~63.0 at 0.2, recovers to ~64.0.
#### Average
- **32b (Yellow)**: Starts at ~68.0, rises to ~69.0.
- **14b (Green)**: Starts at ~67.0, increases to ~67.5.
- **3b (Blue)**: Starts at ~65.0, rises to ~65.5.
- **0.5b (Purple)**: Dips to ~63.0 at 0.2, recovers to ~64.0.
---
### Key Observations
1. **Model Size Correlation**: Larger models (32b, 14b) consistently achieve higher RM@8 accuracy across all datasets.
2. **Training Instability**: Smaller models (0.5b, 1.5b) exhibit dips in accuracy during early training (e.g., 0.2–0.4 progress).
3. **Dataset Variability**:
- GSM8K and Olympiad Bench show the highest accuracy gains.
- Math 500 and Gaokao2023EN exhibit more volatility in smaller models.
4. **Average Trend**: The "Average" graph mirrors individual dataset trends, confirming consistency across tasks.
---
### Interpretation
- **Performance Scaling**: Larger models (32b, 14b) demonstrate superior accuracy, suggesting that parameter count correlates with task performance.
- **Training Dynamics**: Smaller models (0.5b, 1.5b) experience instability during early training, potentially due to optimization challenges or data scarcity.
- **Dataset-Specific Behavior**: Tasks like GSM8K and Olympiad Bench may require higher model capacity, while others (e.g., Math 500) show mixed results, indicating task-dependent scaling laws.
- **Redundant Y-Axis**: The duplicated "RM@8 Accuracy" labels on both axes suggest a possible visualization error, though the data remains interpretable.
This analysis highlights the importance of model size in achieving accuracy and underscores the need for stable training protocols, particularly for smaller models.