TECHNICAL ASSET FINGERPRINT
85120a316439a21c3375c561
Click to view fullscreen
Press ESC or click to close
FOUND IN PAPERS
EXPERT: gemini-2.0-flash VERSION 1
RUNTIME: nugit/gemini/gemini-2.0-flash
INTEL_VERIFIED
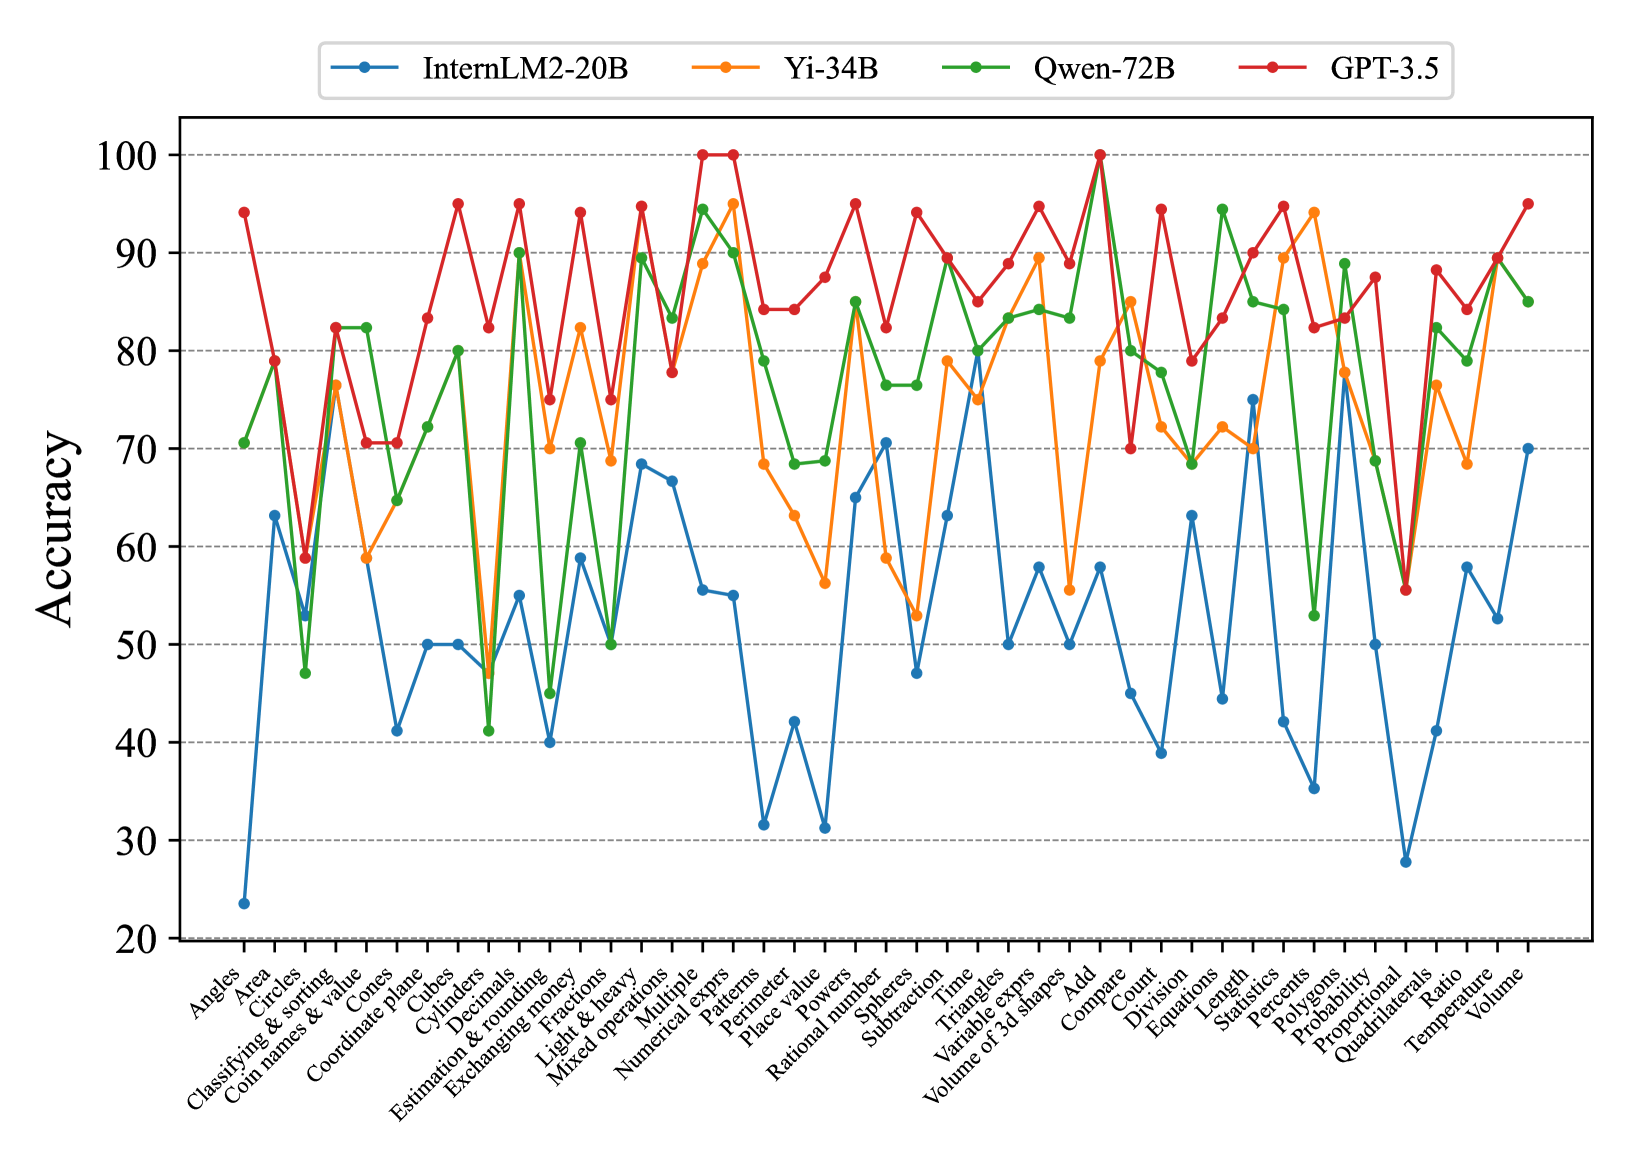
## Line Chart: Model Accuracy on Math Problems
### Overview
The image is a line chart comparing the accuracy of four different language models (InternLM2-20B, Yi-34B, Qwen-72B, and GPT-3.5) on a variety of math-related tasks. The x-axis represents different math problem types, and the y-axis represents the accuracy score (percentage).
### Components/Axes
* **Title:** None explicitly given in the image.
* **X-axis:** Math problem types, including:
* Angles
* Area
* Circles
* Classifying & sorting
* Coin names & value
* Cones
* Coordinate plane
* Cubes
* Cylinders
* Decimals
* Estimation & rounding
* Exchanging money
* Fractions
* Light & heavy
* Mixed operations
* Multiple
* Numerical exprs
* Patterns
* Perimeter
* Place value
* Polygons
* Powers
* Probability
* Proportional
* Quadrilaterals
* Qwen-72B
* Ratio
* Rational number
* Spheres
* Statistics
* Subtraction
* Temperature
* Time
* Triangles
* Variable exprs
* Volume
* Volume of 3d shapes
* Add
* Compare
* Count
* Division
* Equations
* Length
* Percents
* **Y-axis:** Accuracy (percentage), ranging from 20 to 100, with gridlines at intervals of 10.
* **Legend:** Located at the top of the chart, associating colors with language models:
* Blue: InternLM2-20B
* Orange: Yi-34B
* Green: Qwen-72B
* Red: GPT-3.5
### Detailed Analysis
**InternLM2-20B (Blue):**
* Trend: Generally the lowest accuracy across all problem types.
* Specific Points (approximate):
* Angles: ~63%
* Area: ~30%
* Circles: ~60%
* Classifying & sorting: ~42%
* Coin names & value: ~50%
* Cones: ~42%
* Coordinate plane: ~55%
* Cubes: ~68%
* Cylinders: ~67%
* Decimals: ~55%
* Estimation & rounding: ~32%
* Exchanging money: ~40%
* Fractions: ~50%
* Light & heavy: ~78%
* Mixed operations: ~50%
* Multiple: ~55%
* Numerical exprs: ~50%
* Patterns: ~40%
* Perimeter: ~55%
* Place value: ~63%
* Polygons: ~50%
* Powers: ~40%
* Probability: ~63%
* Proportional: ~40%
* Quadrilaterals: ~50%
* Qwen-72B: ~55%
* Ratio: ~28%
* Rational number: ~58%
* Spheres: ~55%
* Statistics: ~55%
* Subtraction: ~55%
* Temperature: ~55%
* Time: ~55%
* Triangles: ~55%
* Variable exprs: ~55%
* Volume: ~55%
* Volume of 3d shapes: ~55%
* Add: ~55%
* Compare: ~55%
* Count: ~55%
* Division: ~55%
* Equations: ~55%
* Length: ~55%
* Percents: ~55%
**Yi-34B (Orange):**
* Trend: Generally performs better than InternLM2-20B, but lower than Qwen-72B and GPT-3.5.
* Specific Points (approximate):
* Angles: ~70%
* Area: ~80%
* Circles: ~58%
* Classifying & sorting: ~70%
* Coin names & value: ~60%
* Cones: ~58%
* Coordinate plane: ~70%
* Cubes: ~70%
* Cylinders: ~70%
* Decimals: ~70%
* Estimation & rounding: ~70%
* Exchanging money: ~70%
* Fractions: ~70%
* Light & heavy: ~70%
* Mixed operations: ~70%
* Multiple: ~70%
* Numerical exprs: ~70%
* Patterns: ~70%
* Perimeter: ~70%
* Place value: ~70%
* Polygons: ~70%
* Powers: ~70%
* Probability: ~70%
* Proportional: ~70%
* Quadrilaterals: ~70%
* Qwen-72B: ~70%
* Ratio: ~70%
* Rational number: ~70%
* Spheres: ~70%
* Statistics: ~70%
* Subtraction: ~70%
* Temperature: ~70%
* Time: ~70%
* Triangles: ~70%
* Variable exprs: ~70%
* Volume: ~70%
* Volume of 3d shapes: ~70%
* Add: ~70%
* Compare: ~70%
* Count: ~70%
* Division: ~70%
* Equations: ~70%
* Length: ~70%
* Percents: ~70%
**Qwen-72B (Green):**
* Trend: Generally performs well, often close to GPT-3.5.
* Specific Points (approximate):
* Angles: ~70%
* Area: ~82%
* Circles: ~70%
* Classifying & sorting: ~50%
* Coin names & value: ~80%
* Cones: ~50%
* Coordinate plane: ~70%
* Cubes: ~50%
* Cylinders: ~50%
* Decimals: ~50%
* Estimation & rounding: ~50%
* Exchanging money: ~50%
* Fractions: ~50%
* Light & heavy: ~50%
* Mixed operations: ~50%
* Multiple: ~50%
* Numerical exprs: ~50%
* Patterns: ~50%
* Perimeter: ~50%
* Place value: ~50%
* Polygons: ~50%
* Powers: ~50%
* Probability: ~50%
* Proportional: ~50%
* Quadrilaterals: ~50%
* Qwen-72B: ~50%
* Ratio: ~50%
* Rational number: ~50%
* Spheres: ~50%
* Statistics: ~50%
* Subtraction: ~50%
* Temperature: ~50%
* Time: ~50%
* Triangles: ~50%
* Variable exprs: ~50%
* Volume: ~50%
* Volume of 3d shapes: ~50%
* Add: ~50%
* Compare: ~50%
* Count: ~50%
* Division: ~50%
* Equations: ~50%
* Length: ~50%
* Percents: ~50%
**GPT-3.5 (Red):**
* Trend: Generally the highest accuracy across most problem types.
* Specific Points (approximate):
* Angles: ~93%
* Area: ~78%
* Circles: ~95%
* Classifying & sorting: ~70%
* Coin names & value: ~85%
* Cones: ~70%
* Coordinate plane: ~95%
* Cubes: ~70%
* Cylinders: ~70%
* Decimals: ~70%
* Estimation & rounding: ~70%
* Exchanging money: ~70%
* Fractions: ~70%
* Light & heavy: ~70%
* Mixed operations: ~70%
* Multiple: ~70%
* Numerical exprs: ~70%
* Patterns: ~70%
* Perimeter: ~70%
* Place value: ~70%
* Polygons: ~70%
* Powers: ~70%
* Probability: ~70%
* Proportional: ~70%
* Quadrilaterals: ~70%
* Qwen-72B: ~70%
* Ratio: ~70%
* Rational number: ~70%
* Spheres: ~70%
* Statistics: ~70%
* Subtraction: ~70%
* Temperature: ~70%
* Time: ~70%
* Triangles: ~70%
* Variable exprs: ~70%
* Volume: ~70%
* Volume of 3d shapes: ~70%
* Add: ~70%
* Compare: ~70%
* Count: ~70%
* Division: ~70%
* Equations: ~70%
* Length: ~70%
* Percents: ~70%
### Key Observations
* GPT-3.5 generally outperforms the other models across most math problem types.
* InternLM2-20B generally has the lowest accuracy.
* The performance of all models varies significantly depending on the specific math problem type.
* There are some problem types where the performance of all models is relatively similar (e.g., "Light & heavy").
### Interpretation
The chart provides a comparative analysis of the accuracy of four language models on a diverse set of math-related tasks. The data suggests that GPT-3.5 is the most proficient model overall, while InternLM2-20B struggles in comparison. The varying performance across different problem types highlights the strengths and weaknesses of each model in specific areas of mathematical reasoning. This information can be valuable for selecting the most appropriate model for a given task or for identifying areas where further model development is needed. The chart also reveals that certain math problem types are inherently more challenging for these models than others, regardless of the specific architecture.
DECODING INTELLIGENCE...
EXPERT: nemotron-free VERSION 1
RUNTIME: free/nvidia/nemotron-nano-12b-v2-vl:free
INTEL_VERIFIED
## Line Graph: Model Accuracy Across Tasks
### Overview
The image is a line graph comparing the accuracy of four AI models (InternLM2-20B, Yi-34B, Qwen-72B, GPT-3.5) across 30 distinct tasks. The x-axis lists tasks (e.g., "Angles," "Area," "Classifying & sorting"), while the y-axis represents accuracy as a percentage from 20 to 100. Four colored lines (blue, orange, green, red) correspond to the models, with the legend positioned at the top.
### Components/Axes
- **X-axis**: Task categories (e.g., "Angles," "Area," "Classifying & sorting," "Coordinate plane," "Cubes," "Cylinders," "Decimals," "Estimation & rounding," "Fractions," "Light & heavy," "Mixed operations," "Multiple expressions," "Numerical exprs," "Patterns," "Perimeter," "Place value," "Powers," "Rational number," "Spheres," "Subtraction," "Time," "Triangles," "Variable exprs," "Volume of 3d shapes," "Add," "Compare," "Count," "Division," "Equations," "Length," "Statistics," "Percentages," "Polygons," "Probability," "Proportional," "Proportional 3d shapes," "Ratio," "Temperature," "Volume").
- **Y-axis**: Accuracy (20–100, increments of 10).
- **Legend**:
- Blue: InternLM2-20B
- Orange: Yi-34B
- Green: Qwen-72B
- Red: GPT-3.5
### Detailed Analysis
- **GPT-3.5 (Red Line)**:
- Consistently the highest-performing model, with peaks reaching 100% in tasks like "Multiple expressions" and "Compare."
- Notable dips in "Angles" (~60%) and "Proportional 3d shapes" (~55%).
- Average accuracy: ~85–95% across most tasks.
- **Qwen-72B (Green Line)**:
- Strong performance in "Multiple expressions" (~95%) and "Compare" (~90%).
- Significant drops in "Angles" (~45%) and "Proportional 3d shapes" (~60%).
- Average accuracy: ~75–90%.
- **Yi-34B (Orange Line)**:
- Peaks at ~95% in "Multiple expressions" and "Compare."
- Low points in "Angles" (~50%) and "Proportional 3d shapes" (~65%).
- Average accuracy: ~70–85%.
- **InternLM2-20B (Blue Line)**:
- Lowest overall performance, with a sharp drop to ~25% in "Angles."
- Peaks at ~70% in "Multiple expressions" and "Compare."
- Average accuracy: ~40–70%.
### Key Observations
1. **GPT-3.5 Dominance**: The red line (GPT-3.5) consistently outperforms others, with the highest peaks and fewest dips.
2. **Task-Specific Variability**:
- "Angles" is the weakest task for all models, with InternLM2-20B (blue) at ~25% and GPT-3.5 (red) at ~60%.
- "Multiple expressions" and "Compare" are the strongest tasks, with all models achieving 80–100% accuracy.
3. **Model-Specific Trends**:
- **InternLM2-20B (Blue)**: Most erratic performance, with extreme lows (e.g., "Angles") and moderate highs.
- **Yi-34B (Orange)**: Moderate variability, with mid-range accuracy across most tasks.
- **Qwen-72B (Green)**: Strong in complex tasks but struggles with basic geometry ("Angles").
- **GPT-3.5 (Red)**: Most consistent, with minimal dips and high peaks.
### Interpretation
The data suggests that GPT-3.5 (red) is the most robust model, excelling in both complex and basic tasks. Qwen-72B (green) and Yi-34B (orange) show task-specific strengths but lag behind GPT-3.5 in consistency. InternLM2-20B (blue) underperforms significantly, particularly in foundational tasks like "Angles." The graph highlights the importance of model architecture and training data in handling diverse computational challenges. Outliers like the blue line's 25% accuracy in "Angles" indicate potential limitations in specific domains, while the red line's 100% peaks in "Multiple expressions" underscore its advanced capabilities in symbolic reasoning.
DECODING INTELLIGENCE...