## Multiple Line Charts: Citation Metrics Over Time for Four Researchers
### Overview
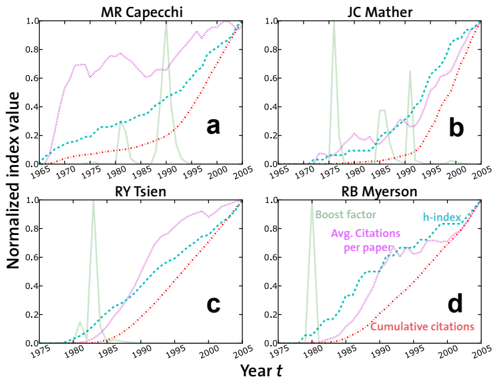
The image presents four line charts (arranged in a 2x2 grid) showing citation metrics over time for four researchers: MR Capecchi, JC Mather, RY Tsien, and RB Myerson. Each chart displays the "Boost factor", "Avg. Citations per paper", "h-index", and "Cumulative citations" as functions of time (Year t). The y-axis represents a normalized index value.
### Components/Axes
* **Titles:**
* Top-left: MR Capecchi
* Top-right: JC Mather
* Bottom-left: RY Tsien
* Bottom-right: RB Myerson
* **X-axis (Year t):**
* MR Capecchi and JC Mather: 1965 to 2005, with markers every 5 years.
* RY Tsien and RB Myerson: 1975 to 2005, with markers every 5 years.
* **Y-axis (Normalized index value):** 0.0 to 1.0, with markers every 0.2.
* **Legend (Bottom-right chart):**
* Green: Boost factor
* Pink: Avg. Citations per paper
* Teal: h-index
* Red: Cumulative citations
* **Chart Labels:**
* a (Top-left)
* b (Top-right)
* c (Bottom-left)
* d (Bottom-right)
### Detailed Analysis
**Chart a: MR Capecchi**
* **Boost factor (Green):** A sharp spike around 1990, with values near 0 for the rest of the time. Peak value is approximately 0.7.
* **Avg. Citations per paper (Pink):** Starts around 0 in 1965, rises to approximately 0.7 by 1975, fluctuates between 0.6 and 1.0 until 2000, then drops slightly to approximately 0.9 by 2005.
* **h-index (Teal):** Starts at 0 in 1965, increases steadily to approximately 0.3 by 1980, then increases more slowly to approximately 0.4 by 2005.
* **Cumulative citations (Red):** Starts at 0 in 1965, increases steadily to approximately 0.2 by 2005.
**Chart b: JC Mather**
* **Boost factor (Green):** A sharp spike around 1970 and another around 1990, with values near 0 for the rest of the time. Peak values are approximately 0.9.
* **Avg. Citations per paper (Pink):** Starts around 0 in 1965, fluctuates between 0 and 0.3 until 1990, then increases to approximately 1.0 by 2005.
* **h-index (Teal):** Starts at 0 in 1965, increases steadily to approximately 0.4 by 1990, then increases more rapidly to approximately 1.0 by 2005.
* **Cumulative citations (Red):** Starts at 0 in 1965, increases steadily to approximately 0.9 by 2005.
**Chart c: RY Tsien**
* **Boost factor (Green):** A sharp spike around 1982, with values near 0 for the rest of the time. Peak value is approximately 1.0.
* **Avg. Citations per paper (Pink):** Starts around 0 in 1975, remains near 0 until 1980, then increases to approximately 1.0 by 2005.
* **h-index (Teal):** Starts at 0 in 1975, increases steadily to approximately 0.4 by 2005.
* **Cumulative citations (Red):** Starts at 0 in 1975, increases steadily to approximately 0.2 by 2005.
**Chart d: RB Myerson**
* **Boost factor (Green):** A sharp spike around 1980, with values near 0 for the rest of the time. Peak value is approximately 0.8.
* **Avg. Citations per paper (Pink):** Starts around 0 in 1975, fluctuates between 0 and 0.7 until 2005.
* **h-index (Teal):** Starts at 0 in 1975, increases steadily to approximately 0.8 by 2005.
* **Cumulative citations (Red):** Starts at 0 in 1975, increases steadily to approximately 0.7 by 2005.
### Key Observations
* The "Boost factor" (Green) consistently shows sharp spikes at specific years for all researchers, indicating periods of high impact.
* The "Avg. Citations per paper" (Pink) varies significantly between researchers, with some showing a steady increase and others showing fluctuations.
* The "h-index" (Teal) generally increases steadily over time for all researchers.
* The "Cumulative citations" (Red) also increases steadily over time, but at different rates for each researcher.
### Interpretation
The charts provide a visual representation of the citation impact of four researchers over time. The "Boost factor" highlights specific years where their work had a particularly high impact. The "Avg. Citations per paper" and "h-index" reflect the overall quality and quantity of their publications. The "Cumulative citations" show the total impact of their work over their careers.
The data suggests that each researcher has a unique citation profile. For example, JC Mather's "Avg. Citations per paper" and "h-index" show a rapid increase in later years, while MR Capecchi's "Avg. Citations per paper" remains relatively high throughout the period. RY Tsien and RB Myerson have different patterns, with RY Tsien showing a later increase in "Avg. Citations per paper" and RB Myerson showing a more gradual increase in "h-index" and "Cumulative citations".
The spikes in "Boost factor" could be related to specific publications or events that significantly increased the researchers' visibility and impact. The differences in the other metrics could be due to various factors, such as the field of research, the number of publications, and the citation practices in their respective fields.