## Chart: Normalized Index Value Over Time for Four Researchers
### Overview
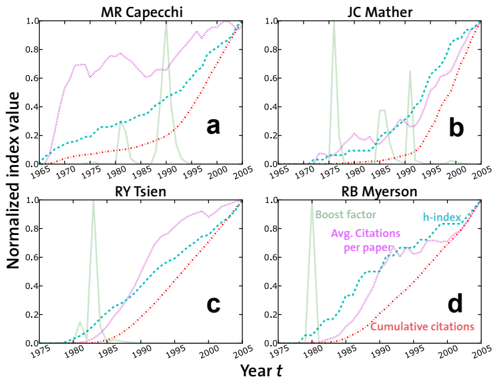
The image presents four separate line charts, arranged in a 2x2 grid, displaying the normalized index value over time for four researchers: Mario R. Capecchi (a), John C. Mather (b), Roger Y. Tsien (c), and Robert B. Myerson (d). Each chart plots three different metrics against the year (t) from approximately 1965 to 2005. A vertical green line appears in each chart around the year 1980, representing a "Boost factor".
### Components/Axes
* **X-axis:** Year t, ranging from approximately 1965 to 2005.
* **Y-axis:** Normalized index value, ranging from 0 to 1.0.
* **Legend:** Located in the top-right corner of the entire image, defining the colors and metrics:
* Blue: Avg. Citations per paper
* Pink: h-Index
* Red: Cumulative citations
* **Titles:** Each subplot is labeled with the researcher's name:
* a: MR Capecchi
* b: JC Mather
* c: RY Tsien
* d: RB Myerson
### Detailed Analysis or Content Details
**Chart a: MR Capecchi**
* **Avg. Citations per paper (Blue):** Starts around 0.1 in 1965, fluctuates significantly, peaking around 0.7 in 1985, then declines to approximately 0.4 in 2005.
* **h-Index (Pink):** Begins at approximately 0.2 in 1965, increases steadily to around 0.8 in 2005.
* **Cumulative citations (Red):** Starts near 0 in 1965, rises to approximately 0.6 in 1985, and continues to increase to around 0.9 in 2005.
**Chart b: JC Mather**
* **Avg. Citations per paper (Blue):** Starts around 0.1 in 1965, shows a large spike around 1980 (boost factor), then fluctuates, increasing to approximately 0.6 in 2005.
* **h-Index (Pink):** Begins at approximately 0.1 in 1965, increases steadily to around 0.9 in 2005.
* **Cumulative citations (Red):** Starts near 0 in 1965, rises to approximately 0.4 in 1980, and continues to increase to around 0.8 in 2005.
**Chart c: RY Tsien**
* **Avg. Citations per paper (Blue):** Starts around 0.1 in 1975, fluctuates, peaking around 0.6 in 1995, and declines to approximately 0.4 in 2005.
* **h-Index (Pink):** Begins at approximately 0.1 in 1975, increases steadily to around 0.8 in 2005.
* **Cumulative citations (Red):** Starts near 0 in 1975, rises to approximately 0.5 in 1995, and continues to increase to around 0.8 in 2005.
**Chart d: RB Myerson**
* **Avg. Citations per paper (Blue):** Starts around 0.1 in 1975, increases steadily to approximately 0.5 in 2005.
* **h-Index (Pink):** Begins at approximately 0.1 in 1975, increases rapidly after 1990, reaching approximately 0.9 in 2005.
* **Cumulative citations (Red):** Starts near 0 in 1975, increases steadily to approximately 0.7 in 2005.
### Key Observations
* The h-Index consistently shows a positive trend for all researchers, indicating increasing impact over time.
* The "Boost factor" (green line) around 1980 appears to correlate with a temporary increase in average citations per paper for Mather.
* Cumulative citations generally increase over time, but the rate of increase varies between researchers.
* Myerson's h-Index shows a particularly steep increase after 1990, suggesting a period of significant recognition.
* Capecchi and Tsien show more fluctuation in average citations per paper compared to Mather and Myerson.
### Interpretation
The charts illustrate the scholarly impact of four Nobel laureates over their careers, as measured by three different bibliometric indicators. The consistent upward trend in h-Index for all researchers suggests a general increase in their influence and recognition over time. The "Boost factor" around 1980 likely represents a significant publication or event that increased their visibility. The differences in the trajectories of the three metrics (average citations, h-index, and cumulative citations) provide a nuanced view of their impact. For example, a high cumulative citation count indicates a large body of work, while a high h-index suggests a concentration of highly cited papers. The variations between the researchers highlight the different patterns of scholarly achievement and recognition. The data suggests that the h-index is a robust metric for tracking long-term scholarly impact, while average citations per paper can be more sensitive to short-term fluctuations. The steep increase in Myerson's h-index after 1990 could be attributed to the impact of his work on game theory and economics gaining wider recognition.