## Line Graphs: Normalized Index Values Over Time for Four Researchers
### Overview
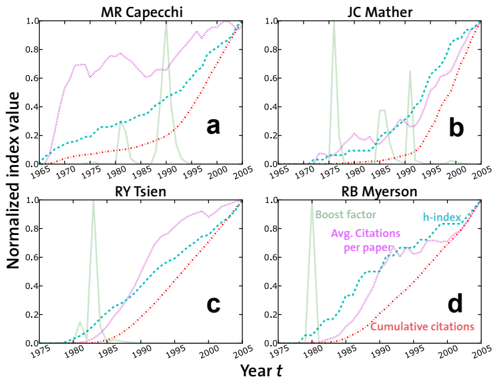
The image contains four line graphs (a-d) comparing normalized index values over time (1965–2005) for four researchers: MR Capecci, JC Mather, RY Tsien, and RB Myerson. Each graph tracks three metrics: **Boost factor** (green), **Avg. Citations per paper** (purple), and **Cumulative citations** (red). The y-axis represents normalized index values (0–1), and the x-axis spans 40 years.
---
### Components/Axes
- **X-axis**: "Year t" (1965–2005, labeled at 5-year intervals).
- **Y-axis**: "Normalized index value" (0–1, with gridlines).
- **Legends**: Located in the top-right corner of each graph, with color-coded labels:
- **Green**: Boost factor
- **Purple**: Avg. Citations per paper
- **Red**: Cumulative citations
- **Graph Titles**: Positioned at the top of each subplot (e.g., "MR Capecci" for graph a).
---
### Detailed Analysis
#### Graph a (MR Capecci)
- **Boost factor (green)**: Peaks sharply around 1980 (~0.8), then declines to ~0.2 by 2005.
- **Avg. Citations per paper (purple)**: Gradual increase from ~0.1 (1965) to ~0.7 (2005).
- **Cumulative citations (red)**: Steady rise from ~0.05 (1965) to ~0.9 (2005), with minor fluctuations.
#### Graph b (JC Mather)
- **Boost factor (green)**: Peaks earlier (~1975, ~0.9), then drops to ~0.3 by 2005.
- **Avg. Citations per paper (purple)**: Slower growth (~0.1 to ~0.6).
- **Cumulative citations (red)**: Moderate increase (~0.05 to ~0.7), with a plateau post-1990.
#### Graph c (RY Tsien)
- **Boost factor (green)**: Gradual rise to ~0.6 by 1990, then stabilizes.
- **Avg. Citations per paper (purple)**: Consistent growth (~0.1 to ~0.8).
- **Cumulative citations (red)**: Steady climb (~0.05 to ~0.9), with a sharp rise post-1995.
#### Graph d (RB Myerson)
- **Boost factor (green)**: Sharp peak (~1980, ~0.9), then declines to ~0.4.
- **Avg. Citations per paper (purple)**: Rapid growth (~0.1 to ~0.8).
- **Cumulative citations (red)**: Strong upward trend (~0.05 to ~0.9), with a steep rise post-1990.
---
### Key Observations
1. **Boost factor** (green) peaks in the 1970s–1980s for all researchers, suggesting a short-term impact metric.
2. **Avg. Citations per paper** (purple) and **Cumulative citations** (red) show sustained growth, indicating long-term scholarly influence.
3. **JC Mather** (b) and **RB Myerson** (d) exhibit the most pronounced early peaks in Boost factor, while **RY Tsien** (c) demonstrates the most gradual increase.
4. **Cumulative citations** (red) consistently outperform other metrics by 2005, highlighting their importance in long-term evaluation.
---
### Interpretation
The data suggests that **initial impact** (Boost factor) diminishes over time, while **citation-based metrics** (Avg. and Cumulative) reflect enduring scholarly value. Researchers with earlier peaks in Boost factor (e.g., JC Mather, RB Myerson) may have had groundbreaking early work, but their long-term influence depends on sustained citation accumulation. The divergence between short-term and long-term metrics underscores the need for balanced evaluation frameworks in academic research. Notably, **RY Tsien** (c) shows the most balanced growth across all metrics, suggesting consistent contributions over time.