## Flowchart Diagram: Technical Process for Evaluating Systems and Mechanisms
### Overview
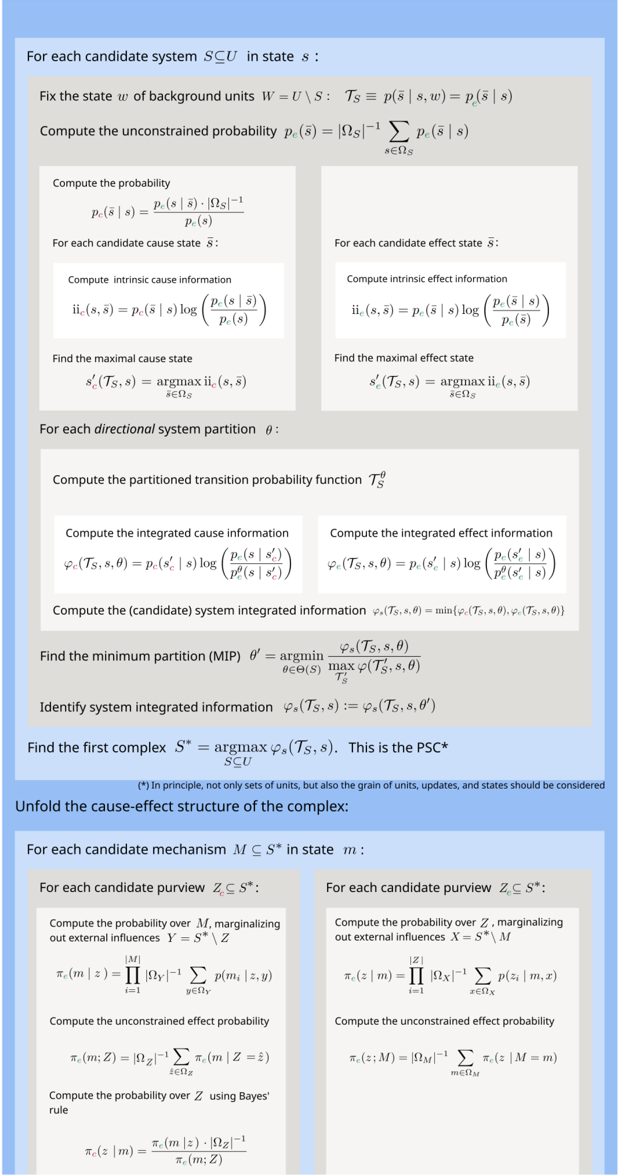
The image depicts a structured flowchart outlining a technical process for evaluating candidate systems and mechanisms. It involves probabilistic computations, causal analysis, and information integration, likely within a theoretical framework (e.g., Bayesian inference or Integrated Information Theory). The diagram is divided into two main sections: **candidate system evaluation** (left) and **candidate mechanism evaluation** (right), with shared computational principles.
---
### Components/Axes
#### Left Section: Candidate System Evaluation (`S ⊆ U` in state `s`)
1. **State Fixing**:
- Fix background state `w` via `W = U \ S`.
- Compute unconstrained probability:
`p(s) = |Ωs|⁻¹ Σ_{s∈Ωs} p(s|s)`.
- Compute probability:
`p(s|s) = p(s|s, Ωs)^-1 / p(s)`.
2. **Cause-Effect Analysis**:
- For each candidate cause state `s̃`:
- Compute intrinsic cause information:
`ii(s, s̃) = p(s|s) log(p(s|s) / p(s))`.
- Find maximal cause state:
`s'_c(TS, s) = argmax_{s̃∈Ωs} ii(s, s̃)`.
3. **Directional System Partition**:
- For each partition `θ`:
- Compute partitioned transition probability:
`TS^θ`.
- Compute integrated cause/effect information:
`φ_c(TS, s, s') = p(s|s) log(p(s|s) / p'(s|s'))`.
- Compute system integrated information:
`φ_s(TS, s, θ) = min(φ_c(TS, s, θ), φ_c(TS, s, θ))`.
4. **Minimal Partition Identification**:
- Find minimal partition (MIP):
`θ' = argmin_{θ∈(S)} max_{TS} φ(TS, s, θ)`.
5. **System Integrated Information**:
- `φ_s(TS, s) = φ_s(TS, s, θ')`.
6. **Complex Identification**:
- `S* = argmax_{S⊆U} φ_s(TS, s)`.
- Labeled as "PSC*" (possibly a specific model or algorithm).
#### Right Section: Candidate Mechanism Evaluation (`M ⊆ S*` in state `m`)
1. **Purview Analysis**:
- For each candidate purview `Z ⊆ S*`:
- Compute probability over `M`, marginalizing external influences:
`π(m|z) = Π_{i=1}^|M| [β_i]^{-1} Σ_{y∈Y} p(m_i|z, y)`.
- Compute unconstrained effect probability:
`π(m|z) = |Ωz|⁻¹ Σ_{z∈Ωz} π(m|Z = z)`.
- Compute probability over `Z` using Bayes' rule:
`π(z|m) = p(z|m) · |Ωz|⁻¹ / π(m|z)`.
2. **Effect Analysis**:
- For each candidate purview `Z ⊆ S*`:
- Compute probability over `Z`, marginalizing external influences:
`π(z|m) = Π_{i=1}^|Z| [β_i]^{-1} Σ_{x∈X} p(z_i|m, x)`.
- Compute unconstrained effect probability:
`π(z|m) = |Ωz|⁻¹ Σ_{z∈Ωz} π(z|Z = z)`.
- Compute probability over `Z` using Bayes' rule:
`π(z|m) = p(z|m) · |Ωz|⁻¹ / π(m|z)`.
---
### Detailed Analysis
#### Left Section: Candidate System Evaluation
- **Probabilistic Foundations**:
The process begins by fixing the background state `w` and computing the unconstrained probability `p(s)` using a uniform distribution over `Ωs`. The conditional probability `p(s|s)` is derived by normalizing `p(s|s, Ωs)`.
- **Causal Inference**:
For each candidate cause state `s̃`, intrinsic cause information (`ii(s, s̃)`) is calculated using KL divergence. The maximal cause state `s'_c` is identified via maximization.
- **Partitioned Dynamics**:
The system is partitioned into directional components (`θ`), and transition probabilities (`TS^θ`) are computed. Integrated cause/effect information (`φ_c`) is derived for each partition, leading to system-level integrated information (`φ_s`).
- **Minimal Partition Selection**:
The minimal partition (`θ'`) is identified by minimizing the maximum integrated information across partitions.
- **Complex Identification**:
The optimal system `S*` is determined by maximizing `φ_s(TS, s)`, labeled as "PSC*" (possibly a reference to a specific theoretical construct).
#### Right Section: Candidate Mechanism Evaluation
- **Purview-Specific Dynamics**:
Mechanisms (`M`) are evaluated within purviews (`Z ⊆ S*`). Probabilities are computed by marginalizing over external influences (`Y` and `X`), using Bayesian updates.
- **Unconstrained Probabilities**:
Unconstrained effect probabilities (`π(m|z)` and `π(z|m)`) are derived by averaging over purview states.
- **Bayesian Updates**:
Bayes' rule is applied to compute posterior probabilities (`π(z|m)` and `π(m|z)`), integrating prior knowledge (`β_i`) and likelihoods.
---
### Key Observations
1. **Symmetry in Structure**:
Both sections follow analogous steps (probability computation, cause-effect analysis, partition evaluation) but differ in focus (systems vs. mechanisms).
2. **Mathematical Rigor**:
The process relies heavily on probabilistic and information-theoretic formulas, suggesting a formal, axiomatic approach.
3. **Terminology**:
Terms like "integrated information" and "Bayes' rule" imply connections to theories such as Integrated Information Theory (IIT) or Bayesian networks.
4. **Note on Unfolding**:
The final note emphasizes considering "units, grain, updates, and states" when unfolding the cause-effect structure, hinting at practical implementation challenges.
---
### Interpretation
This flowchart outlines a **theoretical framework** for evaluating systems (`S`) and mechanisms (`M`) within a probabilistic and causal context. Key elements include:
- **System Evaluation**: Identifying optimal systems (`S*`) via integrated information maximization, akin to IIT's Φ (phi) metric.
- **Mechanism Evaluation**: Assessing mechanisms (`M`) within purviews (`Z`) using Bayesian inference, balancing prior knowledge (`β_i`) and observed data.
- **Causal Hierarchy**: The process distinguishes between *cause* (intrinsic information) and *effect* (external influences), reflecting a dualistic view of agency and environment.
The "PSC*" label suggests a specific algorithm or model for system identification, though its exact nature is not clarified. The emphasis on minimal partitions (`θ'`) and unconstrained probabilities indicates a focus on parsimony and robustness in the evaluation process.
The diagram likely serves as a blueprint for implementing a theoretical model in computational systems, with applications in areas like artificial intelligence, neuroscience, or complex systems analysis.