\n
## Data Table: Function Call Timings
### Overview
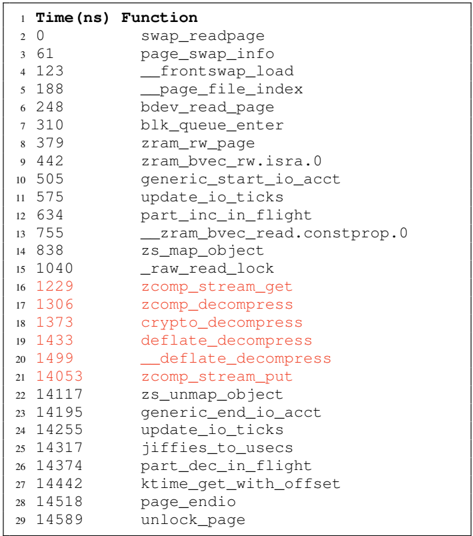
The image presents a data table listing function call timings in nanoseconds (ns). The table appears to represent a trace or profiling data, showing the execution time of various functions.
### Components/Axes
The table has two columns:
* **Time (ns)**: Represents the elapsed time in nanoseconds, starting from 0 and increasing to 14589.
* **Function**: Lists the names of the functions being timed.
The table is numbered from 1 to 29, indicating the sequence of function calls.
### Detailed Analysis or Content Details
Here's a reconstruction of the data table content:
| # | Time (ns) | Function |
| --- | --------- | ----------------------- |
| 1 | 0 | swap_readpage |
| 2 | 61 | page_swap_info |
| 3 | 123 | _frontswap_load |
| 4 | 188 | _page_file_index |
| 5 | 248 | bdev_read_page |
| 6 | 310 | blk_queue_enter |
| 7 | 379 | zram_rw_page |
| 8 | 442 | zram_bvec_rw.isra.0 |
| 9 | 505 | generic_start_io_acct |
| 10 | 575 | update_io_ticks |
| 11 | 634 | part_inc_in_flight |
| 12 | 755 | _zram_bvec_read.constprop.0 |
| 13 | 838 | zs_map_object |
| 14 | 1040 | _raw_read_lock |
| 15 | 1229 | zcomp_stream_get |
| 16 | 1306 | zcomp_decompress |
| 17 | 1373 | crypto_decompress |
| 18 | 1433 | deflate_decompress |
| 19 | 1499 | _deflate_decompress |
| 20 | 14053 | zcomp_stream_put |
| 21 | 14117 | zs_unmap_object |
| 22 | 14195 | generic_end_io_acct |
| 23 | 14255 | update_io_ticks |
| 24 | 14317 | jiffies_to_usecs |
| 25 | 14374 | part_dec_in_flight |
| 26 | 14442 | ktime_get_with_offset |
| 27 | 14518 | page_endio |
| 28 | 14589 | unlock_page |
### Key Observations
* The function timings are not evenly distributed. There are clusters of functions with relatively small timings (e.g., lines 1-12), followed by a jump to larger timings (lines 20-28).
* `update_io_ticks` appears twice in the list (lines 10 and 23), suggesting it's called multiple times during the traced operation.
* The functions starting with an underscore (`_`) likely represent internal or compiler-optimized functions.
* The functions related to compression (`zcomp_stream_get`, `zcomp_decompress`, `crypto_decompress`, `deflate_decompress`) have relatively high timings compared to the initial functions.
### Interpretation
This data table likely represents a performance trace of a system operation involving disk I/O, memory management, and data compression. The initial functions (lines 1-12) seem to be related to setting up and initiating the I/O operation. The compression-related functions (lines 16-19) indicate that data is being compressed during the process, which is computationally expensive. The later functions (lines 20-28) likely represent the completion and cleanup phases of the operation.
The repeated call to `update_io_ticks` suggests that I/O statistics are being updated periodically. The large jump in timings between lines 12 and 20 could indicate a significant operation, such as reading a large block of data from disk or performing a complex compression algorithm.
The data suggests that the compression stage is a performance bottleneck in this operation. Further analysis could involve identifying the specific data being compressed and optimizing the compression algorithm or reducing the amount of data that needs to be compressed. The presence of functions with `.isra.0` and `.constprop.0` suffixes suggests that the code has been optimized using compiler techniques like interprocedural scalar replacement aggregation (ISRA) and constant propagation.