## Table: Function Call Timing Trace
### Overview
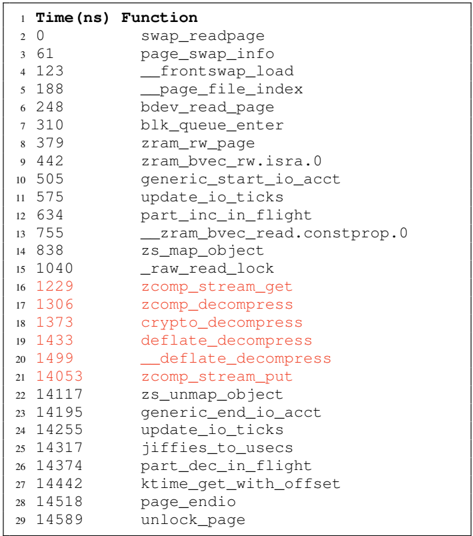
The image displays a two-column table listing function names and their corresponding execution times in nanoseconds (ns). The table appears to be output from a system profiling or tracing tool (like ftrace or perf), capturing a sequential trace of kernel functions involved in a page read operation, likely involving swap, block I/O, and compression (zram). The functions are listed in chronological order of execution.
### Components/Axes
* **Column 1 Header:** `Time (ns)` - Represents the timestamp in nanoseconds since the start of the trace.
* **Column 2 Header:** `Function` - The name of the kernel function being executed.
* **Row Numbers:** A sequential index from 1 to 28 on the far left.
* **Text Formatting:** Most function names are in black text. A contiguous block of functions (rows 15-20) is displayed in red text, visually grouping them.
### Detailed Analysis
The table contains 28 rows of data. Below is the complete transcription:
| Row | Time (ns) | Function |
| :-- | :-------- | :------- |
| 1 | 0 | swap_readpage |
| 2 | 61 | page_swap_info |
| 3 | 123 | __frontswap_load |
| 4 | 188 | __page_file_index |
| 5 | 248 | bdev_read_page |
| 6 | 310 | blk_queue_enter |
| 7 | 379 | zram_rw_page |
| 8 | 442 | zram_bvec_rw.isra.0 |
| 9 | 505 | generic_start_io_acct |
| 10 | 575 | update_io_ticks |
| 11 | 634 | part_inc_in_flight |
| 12 | 755 | __zram_bvec_read.constprop.0 |
| 13 | 838 | zs_map_object |
| 14 | 1040 | _raw_read_lock |
| 15 | 1229 | zcomp_stream_get |
| 16 | 1306 | zcomp_decompress |
| 17 | 1373 | crypto_decompress |
| 18 | 1433 | deflate_decompress |
| 19 | 1499 | __deflate_decompress |
| 20 | 14053 | zcomp_stream_put |
| 21 | 14117 | zs_unmap_object |
| 22 | 14195 | generic_end_io_acct |
| 23 | 14255 | update_io_ticks |
| 24 | 14317 | jiffies_to_usecs |
| 25 | 14374 | part_dec_in_flight |
| 26 | 14442 | ktime_get_with_offset |
| 27 | 14518 | page_endio |
| 28 | 14589 | unlock_page |
**Note on Red Text:** The functions from `zcomp_stream_get` (row 15) through `__deflate_decompress` (row 19) and `zcomp_stream_put` (row 20) are highlighted in red. This visually isolates the compression/decompression subsystem calls within the broader I/O operation.
### Key Observations
1. **Sequential Execution:** The timestamps increase monotonically, indicating a single thread of execution.
2. **Operation Phases:** The trace can be segmented into logical phases:
* **Initiation & Setup (Rows 1-6):** Functions related to swap and block device I initiation (`swap_readpage`, `bdev_read_page`, `blk_queue_enter`).
* **Zram Device Handling (Rows 7-14):** Functions specific to the compressed RAM (zram) block device (`zram_rw_page`, `__zram_bvec_read`, `zs_map_object`).
* **Decompression Core (Rows 15-20, in RED):** The core decompression work. There is a significant time jump between `__deflate_decompress` (1499 ns) and `zcomp_stream_put` (14053 ns), a gap of **~12,554 ns**. This suggests the actual decompression algorithm (`deflate_decompress`) is the most time-consuming step in this sequence.
* **Cleanup & Completion (Rows 21-28):** Unmapping objects, ending I/O accounting, and finalizing the page operation (`zs_unmap_object`, `generic_end_io_acct`, `unlock_page`).
3. **Timing:** The entire traced operation takes approximately **14,589 ns** (or ~14.6 microseconds). The largest single time expenditure is within the decompression phase.
### Interpretation
This data represents a **kernel-level trace of a page-in operation from a compressed swap device (zram)**. The sequence reveals the intricate steps required to read a page of data that is stored in a compressed format in memory.
* **What it demonstrates:** The trace illustrates the overhead of using a compressed memory device. While zram saves physical memory, it trades off CPU time for decompression. The dominant cost here is the `deflate_decompress` function, which is expected as it performs the computational work of expanding the data.
* **Relationship between elements:** The functions form a call chain or execution sequence. The red-highlighted block is a critical sub-sequence where the compressed data is actually processed. The functions before it prepare the I/O and map the compressed object, while the functions after it handle accounting and release locks.
* **Notable Anomalies/Patterns:** The most striking pattern is the **non-linear time progression**. The first 19 steps occur within ~1500 ns, but step 20 (`zcomp_stream_put`) occurs at ~14,053 ns. This indicates that the time between step 19 and 20 is not spent in the functions listed, but rather inside the `deflate_decompress` routine itself, which is called at step 19 and completes just before step 20. This is a classic example of a profiling trace showing where time is *actually* spent versus the number of function calls made. The trace effectively exposes the CPU-intensive decompression as the performance bottleneck in this specific I/O path.