## Bar Chart: Brain Alignment vs. Number of Units for Different Model Sizes
### Overview
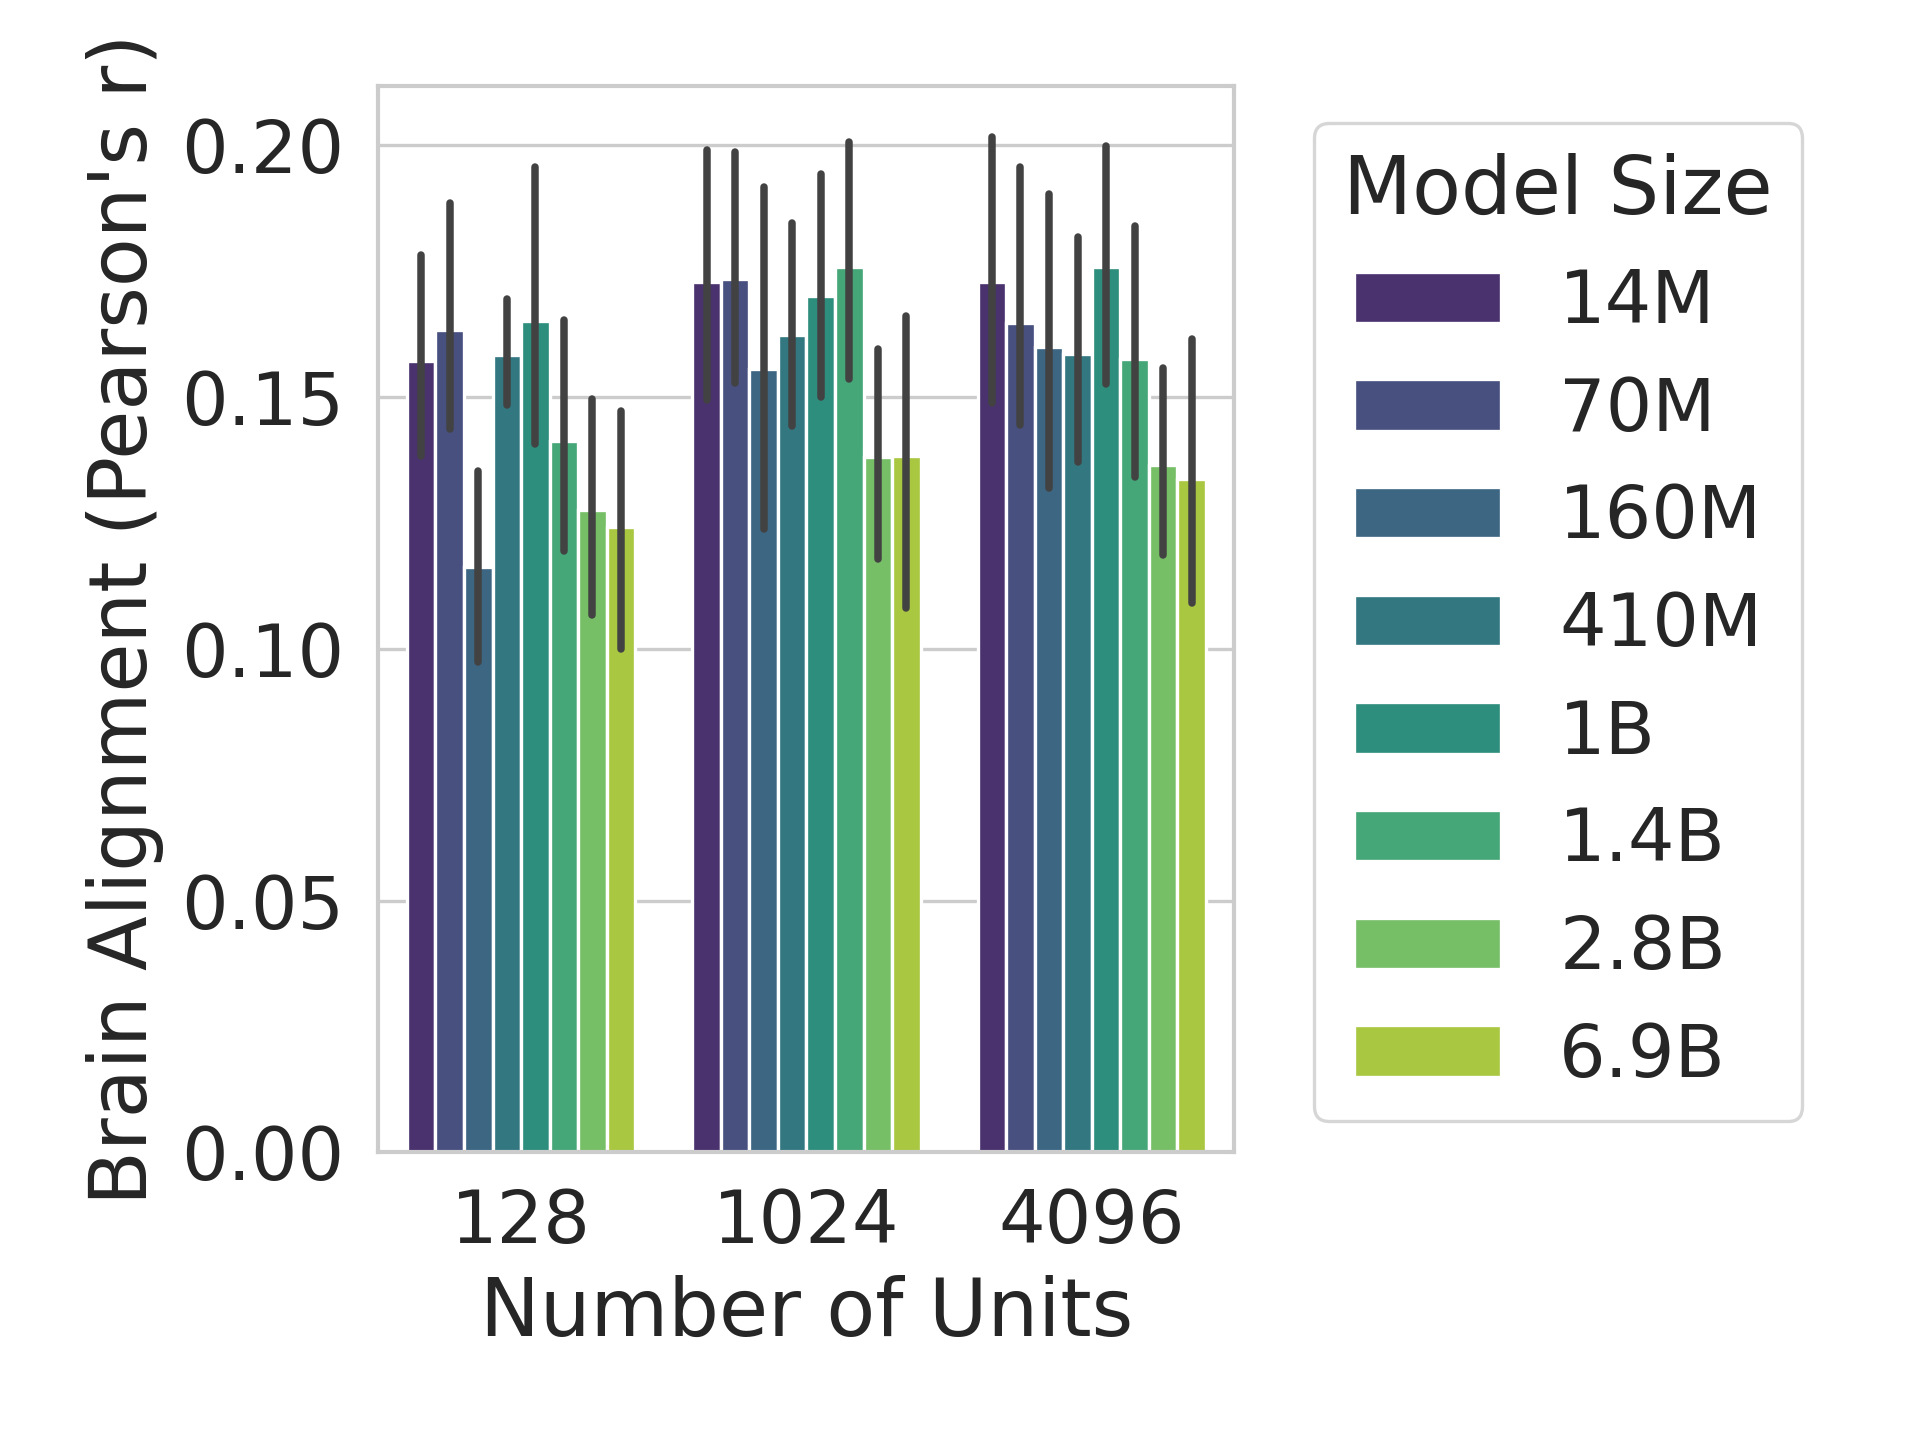
The image is a bar chart comparing brain alignment (measured by Pearson's r) against the number of units in a neural network model. The x-axis represents the number of units (128, 1024, 4096), and the y-axis represents the brain alignment score, ranging from 0.00 to 0.20. Different colored bars represent different model sizes (14M, 70M, 160M, 410M, 1B, 1.4B, 2.8B, 6.9B). Error bars are present on each bar, indicating variability in the data.
### Components/Axes
* **X-axis:** Number of Units (128, 1024, 4096)
* **Y-axis:** Brain Alignment (Pearson's r), ranging from 0.00 to 0.20 in increments of 0.05.
* **Legend (Top-Right):** Model Size
* Dark Purple: 14M
* Dark Blue: 70M
* Blue-Gray: 160M
* Teal: 410M
* Green-Teal: 1B
* Green: 1.4B
* Light Green: 2.8B
* Yellow-Green: 6.9B
### Detailed Analysis
**Number of Units: 128**
* **14M (Dark Purple):** Brain Alignment ~0.16, error bars extend from ~0.14 to ~0.18
* **70M (Dark Blue):** Brain Alignment ~0.17, error bars extend from ~0.15 to ~0.19
* **160M (Blue-Gray):** Brain Alignment ~0.12, error bars extend from ~0.10 to ~0.14
* **410M (Teal):** Brain Alignment ~0.16, error bars extend from ~0.14 to ~0.18
* **1B (Green-Teal):** Brain Alignment ~0.14, error bars extend from ~0.12 to ~0.16
* **1.4B (Green):** Brain Alignment ~0.14, error bars extend from ~0.12 to ~0.16
* **2.8B (Light Green):** Brain Alignment ~0.12, error bars extend from ~0.10 to ~0.14
* **6.9B (Yellow-Green):** Brain Alignment ~0.10, error bars extend from ~0.08 to ~0.12
**Number of Units: 1024**
* **14M (Dark Purple):** Brain Alignment ~0.17, error bars extend from ~0.15 to ~0.19
* **70M (Dark Blue):** Brain Alignment ~0.16, error bars extend from ~0.14 to ~0.18
* **160M (Blue-Gray):** Brain Alignment ~0.15, error bars extend from ~0.13 to ~0.17
* **410M (Teal):** Brain Alignment ~0.17, error bars extend from ~0.15 to ~0.19
* **1B (Green-Teal):** Brain Alignment ~0.16, error bars extend from ~0.14 to ~0.18
* **1.4B (Green):** Brain Alignment ~0.14, error bars extend from ~0.12 to ~0.16
* **2.8B (Light Green):** Brain Alignment ~0.14, error bars extend from ~0.12 to ~0.16
* **6.9B (Yellow-Green):** Brain Alignment ~0.12, error bars extend from ~0.10 to ~0.14
**Number of Units: 4096**
* **14M (Dark Purple):** Brain Alignment ~0.17, error bars extend from ~0.15 to ~0.19
* **70M (Dark Blue):** Brain Alignment ~0.16, error bars extend from ~0.14 to ~0.18
* **160M (Blue-Gray):** Brain Alignment ~0.17, error bars extend from ~0.15 to ~0.19
* **410M (Teal):** Brain Alignment ~0.16, error bars extend from ~0.14 to ~0.18
* **1B (Green-Teal):** Brain Alignment ~0.16, error bars extend from ~0.14 to ~0.18
* **1.4B (Green):** Brain Alignment ~0.14, error bars extend from ~0.12 to ~0.16
* **2.8B (Light Green):** Brain Alignment ~0.14, error bars extend from ~0.12 to ~0.16
* **6.9B (Yellow-Green):** Brain Alignment ~0.12, error bars extend from ~0.10 to ~0.14
### Key Observations
* The brain alignment scores generally range between 0.10 and 0.20 across all model sizes and number of units.
* The 14M model consistently shows relatively high brain alignment scores across all unit counts.
* The 6.9B model consistently shows relatively low brain alignment scores across all unit counts.
* The error bars suggest some variability in the brain alignment scores for each model size and number of units.
* There is no clear trend indicating that increasing the number of units consistently improves brain alignment across all model sizes.
### Interpretation
The chart suggests that brain alignment, as measured by Pearson's r, is influenced by both the model size and the number of units in the model. However, the relationship is not straightforward. Smaller models (e.g., 14M) tend to have relatively high brain alignment scores, while the largest model (6.9B) has the lowest. This could indicate that simply increasing model size does not guarantee better brain alignment. The variability indicated by the error bars suggests that other factors, such as model architecture or training data, may also play a significant role. The lack of a clear trend with increasing units suggests that there may be an optimal number of units for brain alignment, or that the effect of unit count is dependent on the model size. Further investigation would be needed to understand the underlying mechanisms driving these observations.