\n
## Bar Chart: Brain Alignment vs. Model Size & Number of Units
### Overview
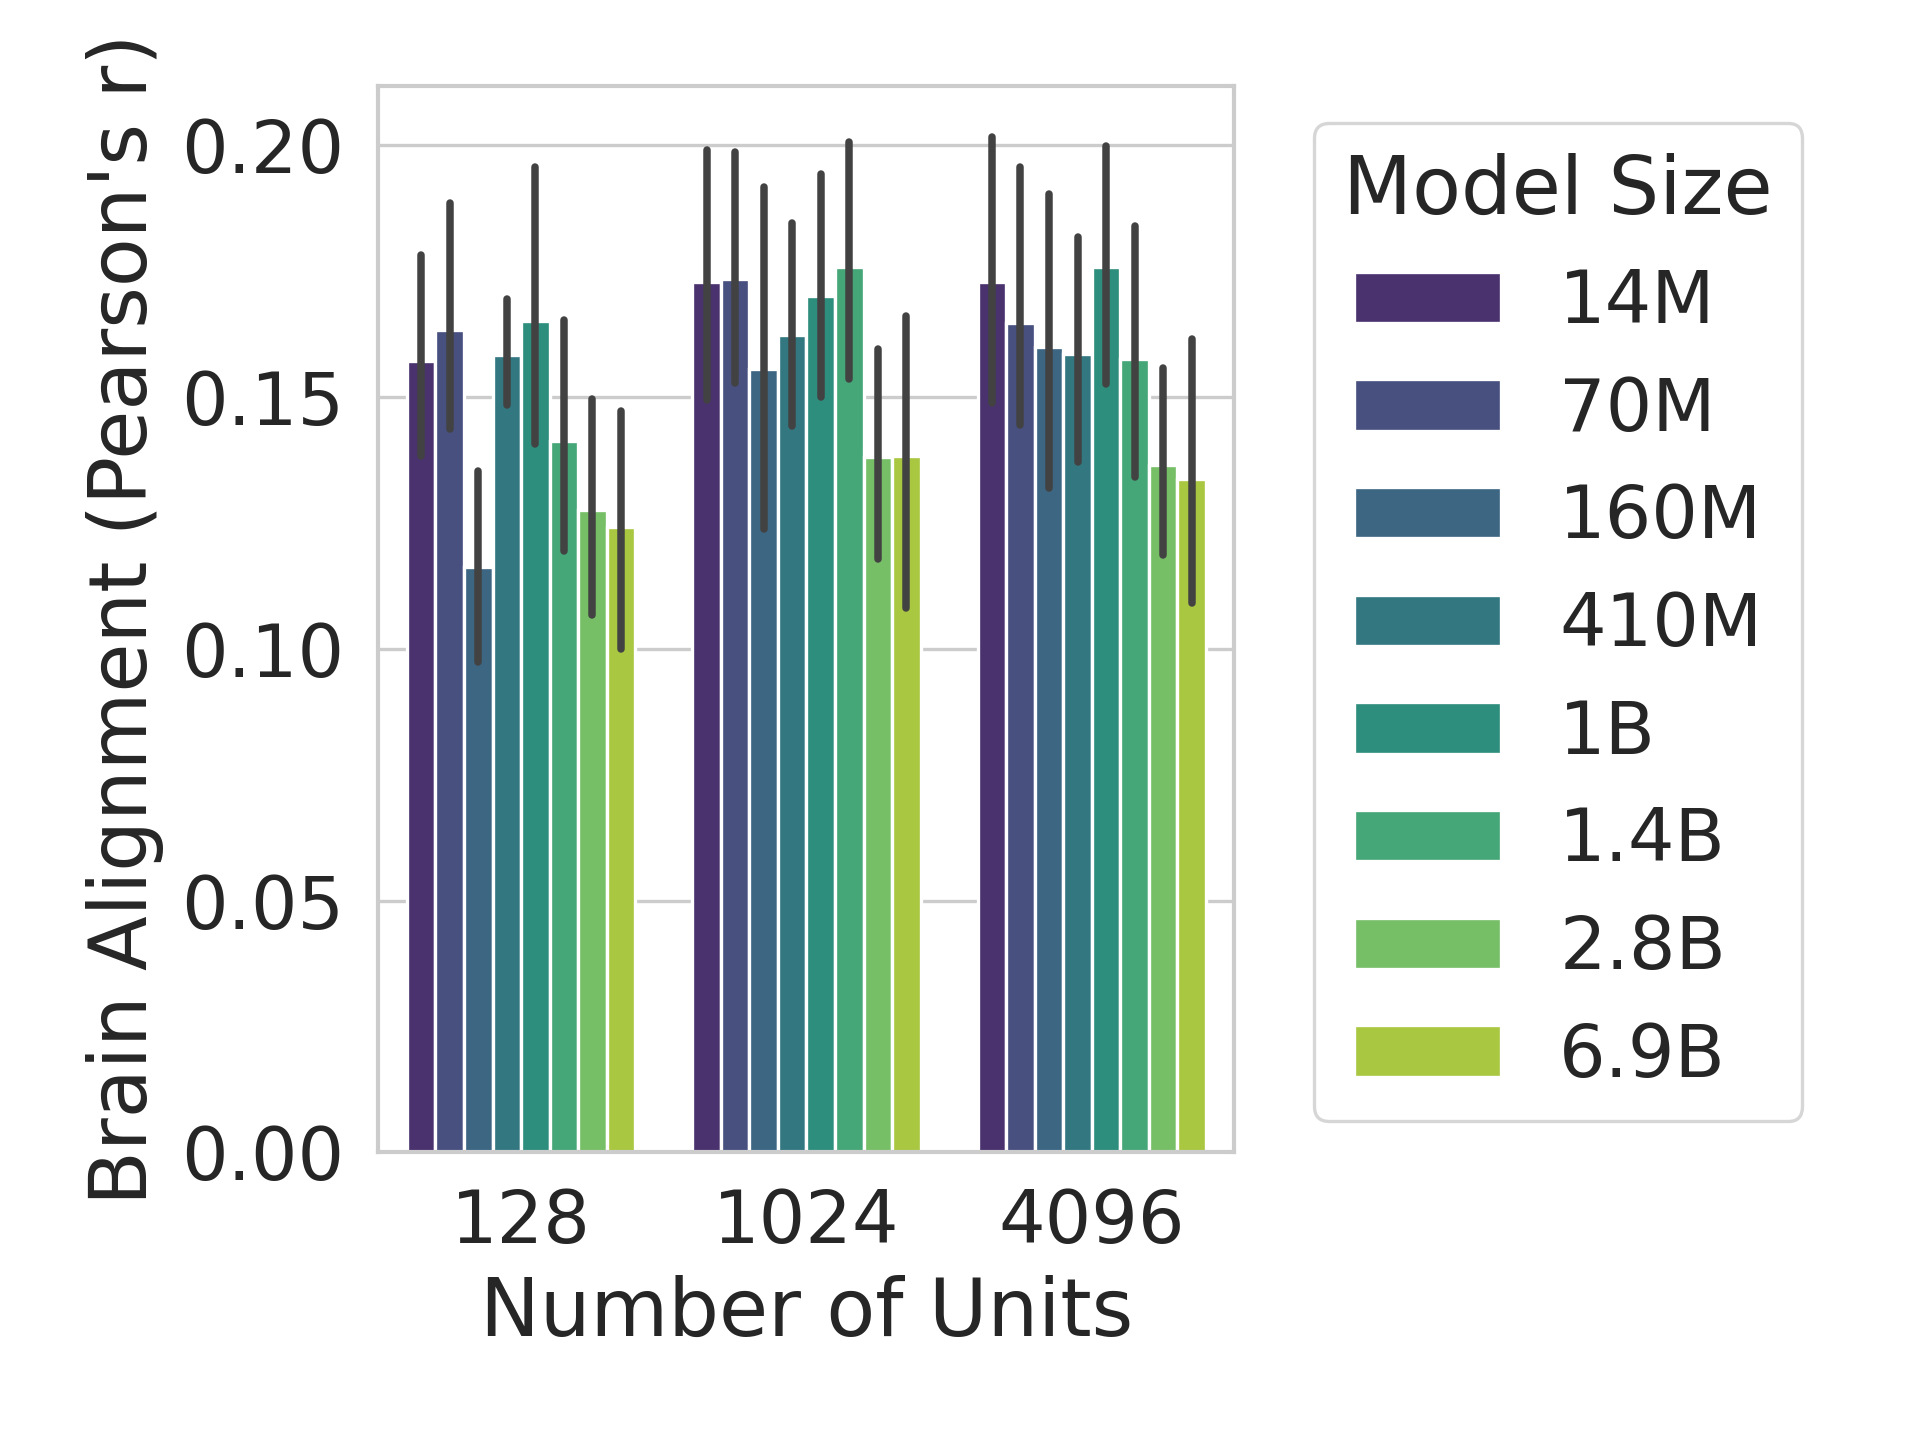
This image presents a bar chart illustrating the relationship between brain alignment (measured by Pearson's r) and two categorical variables: model size and number of units. The chart displays the average brain alignment for different model sizes at three different unit counts (128, 1024, and 4096). Error bars indicate the variability around each mean.
### Components/Axes
* **X-axis:** Number of Units, with markers at 128, 1024, and 4096.
* **Y-axis:** Brain Alignment (Pearson's r), ranging from approximately 0.00 to 0.20.
* **Legend:** Located in the top-right corner, detailing the Model Size categories:
* 14M (Dark Purple)
* 70M (Blue)
* 160M (Grayish Blue)
* 410M (Teal)
* 1B (Green)
* 1.4B (Light Green)
* 2.8B (Pale Green)
* 6.9B (Yellow)
### Detailed Analysis
The chart consists of grouped bar plots. Each group represents a specific number of units (128, 1024, or 4096). Within each group, there are eight bars, each corresponding to a different model size. Each bar is accompanied by an error bar indicating the standard error or confidence interval.
**Data Points (Approximate):**
**Number of Units = 128:**
* 14M: Brain Alignment ≈ 0.16, Error Bar ≈ ±0.02
* 70M: Brain Alignment ≈ 0.14, Error Bar ≈ ±0.02
* 160M: Brain Alignment ≈ 0.13, Error Bar ≈ ±0.02
* 410M: Brain Alignment ≈ 0.14, Error Bar ≈ ±0.02
* 1B: Brain Alignment ≈ 0.15, Error Bar ≈ ±0.02
* 1.4B: Brain Alignment ≈ 0.14, Error Bar ≈ ±0.02
* 2.8B: Brain Alignment ≈ 0.13, Error Bar ≈ ±0.02
* 6.9B: Brain Alignment ≈ 0.12, Error Bar ≈ ±0.02
**Number of Units = 1024:**
* 14M: Brain Alignment ≈ 0.17, Error Bar ≈ ±0.02
* 70M: Brain Alignment ≈ 0.16, Error Bar ≈ ±0.02
* 160M: Brain Alignment ≈ 0.15, Error Bar ≈ ±0.02
* 410M: Brain Alignment ≈ 0.16, Error Bar ≈ ±0.02
* 1B: Brain Alignment ≈ 0.17, Error Bar ≈ ±0.02
* 1.4B: Brain Alignment ≈ 0.16, Error Bar ≈ ±0.02
* 2.8B: Brain Alignment ≈ 0.15, Error Bar ≈ ±0.02
* 6.9B: Brain Alignment ≈ 0.14, Error Bar ≈ ±0.02
**Number of Units = 4096:**
* 14M: Brain Alignment ≈ 0.17, Error Bar ≈ ±0.02
* 70M: Brain Alignment ≈ 0.16, Error Bar ≈ ±0.02
* 160M: Brain Alignment ≈ 0.15, Error Bar ≈ ±0.02
* 410M: Brain Alignment ≈ 0.16, Error Bar ≈ ±0.02
* 1B: Brain Alignment ≈ 0.17, Error Bar ≈ ±0.02
* 1.4B: Brain Alignment ≈ 0.16, Error Bar ≈ ±0.02
* 2.8B: Brain Alignment ≈ 0.15, Error Bar ≈ ±0.02
* 6.9B: Brain Alignment ≈ 0.14, Error Bar ≈ ±0.02
**Trends:**
* For each number of units, the brain alignment values are relatively similar across different model sizes.
* There is a slight tendency for brain alignment to increase as the number of units increases, particularly for smaller model sizes.
* The error bars suggest that the differences in brain alignment between model sizes are not statistically significant.
### Key Observations
* The brain alignment values generally fall between 0.12 and 0.17, indicating a moderate level of alignment.
* The error bars are relatively consistent across all model sizes and unit counts, suggesting that the variability in brain alignment is similar for all conditions.
* The largest model size (6.9B) consistently shows slightly lower brain alignment compared to smaller models, but the difference is not substantial.
### Interpretation
The chart suggests that brain alignment is not strongly dependent on model size, at least within the range tested. The number of units appears to have a more noticeable, though still modest, effect on brain alignment. The relatively small error bars indicate that the observed alignment is reasonably consistent across different runs or samples.
The data implies that increasing model size alone may not be sufficient to improve brain alignment. Other factors, such as the architecture of the model or the training data, may play a more significant role. The slight increase in alignment with more units suggests that increasing model capacity can contribute to better alignment, but the effect is limited.
The consistent error bars across all conditions suggest that the variability in brain alignment is inherent to the system being studied, rather than being driven by differences in model size or unit count. This could be due to noise in the data, limitations in the measurement technique, or fundamental properties of the brain itself.