## Bar Chart: Brain Alignment (Pearson's r) Across Model Sizes and Units
### Overview
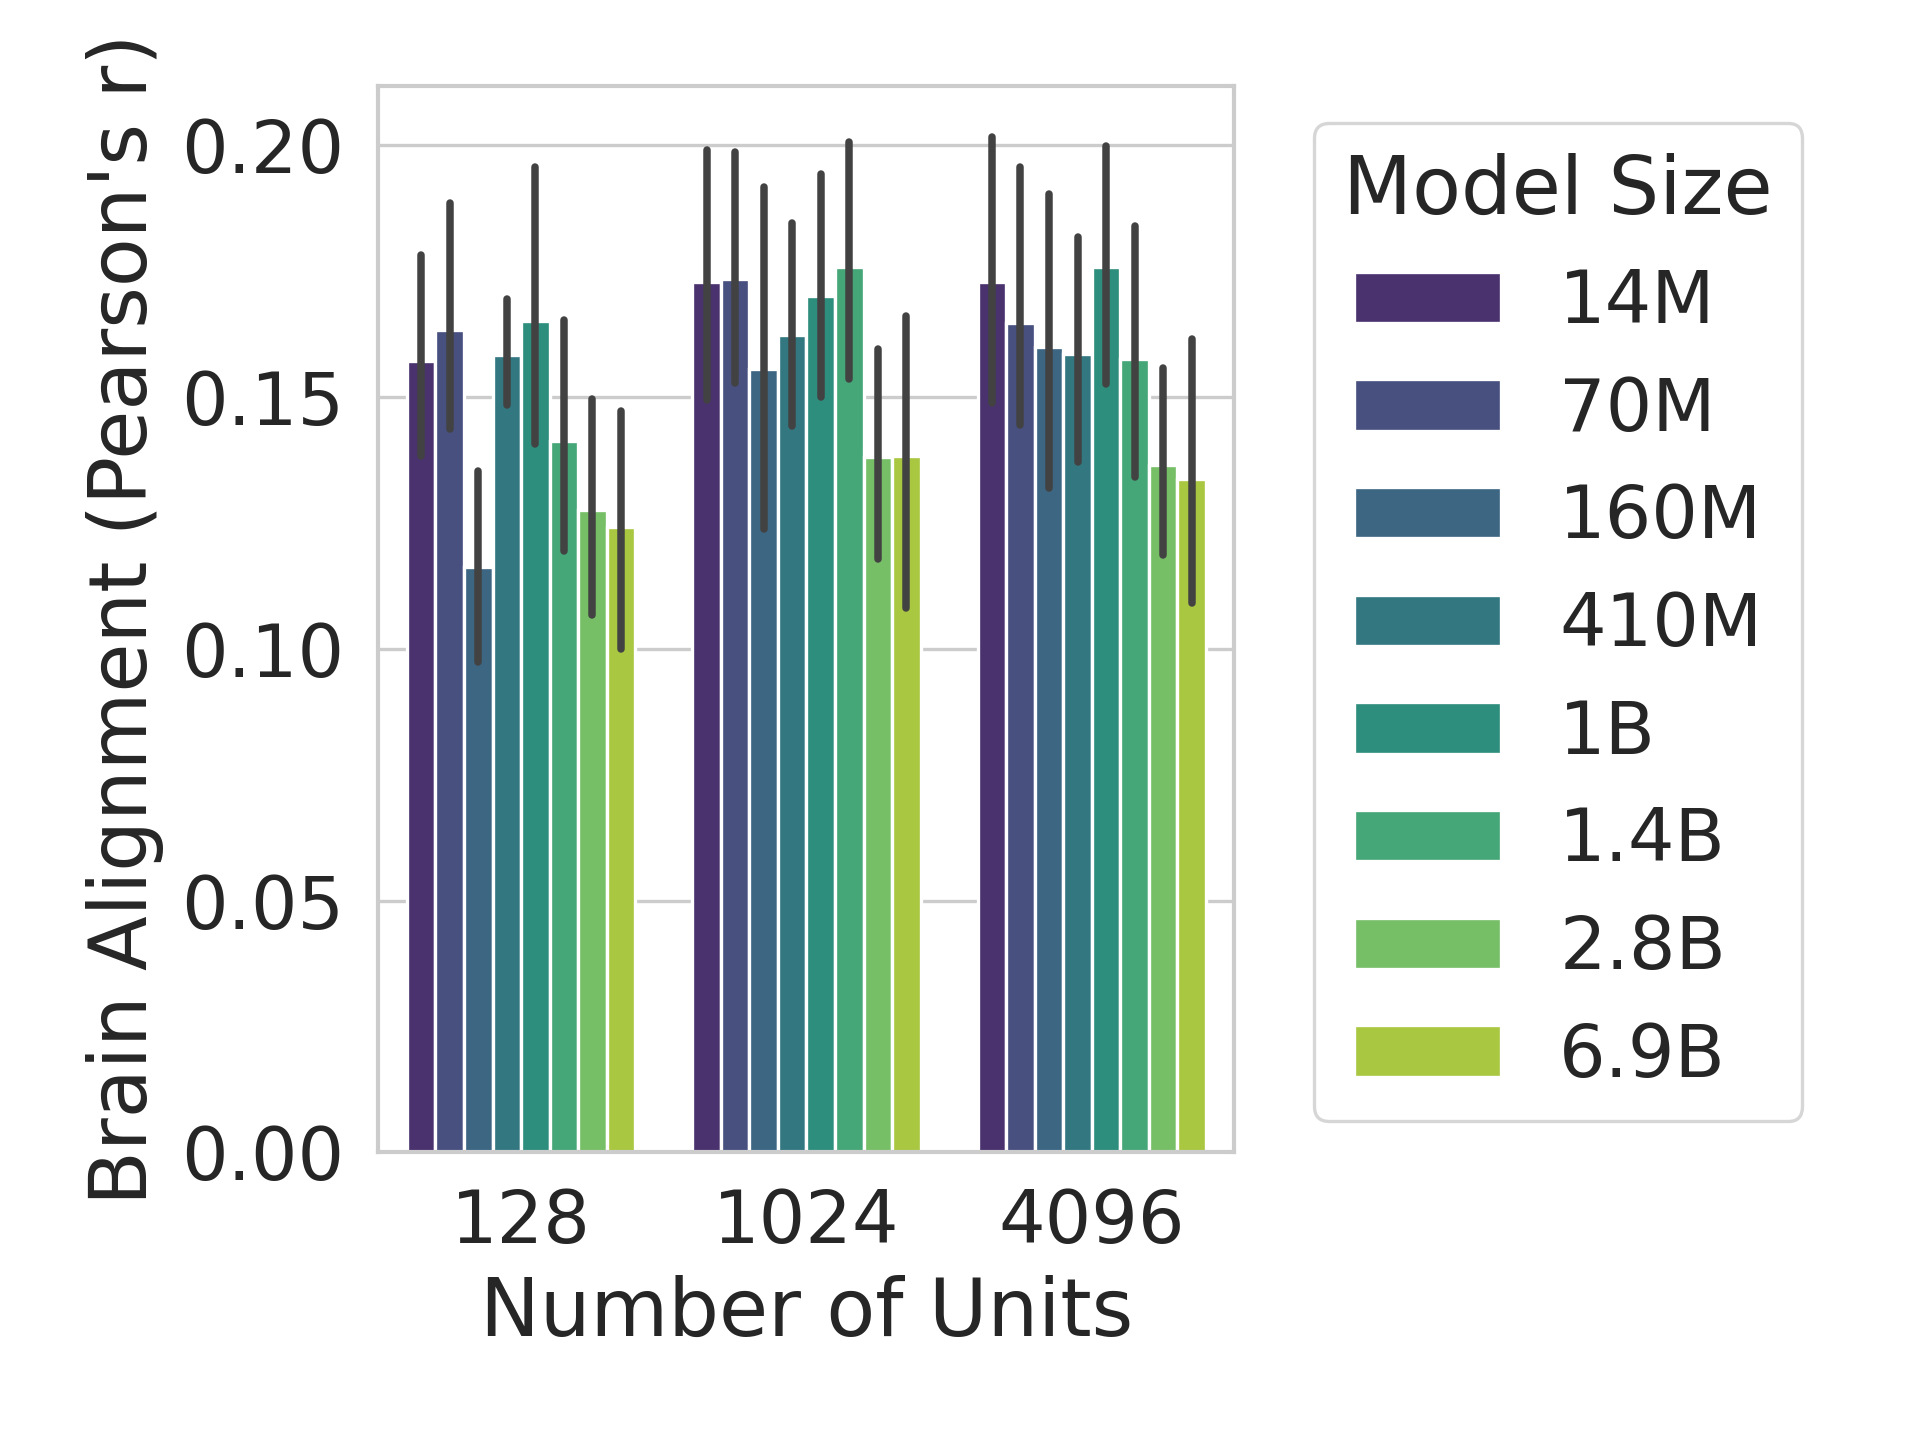
The chart compares brain alignment (measured by Pearson's r) across different neural network model sizes (14M to 6.9B parameters) and three unit counts (128, 1024, 4096). Each model size is represented by a distinct color, with error bars indicating measurement variability.
### Components/Axes
- **X-axis**: "Number of Units" with categories: 128, 1024, 4096.
- **Y-axis**: "Brain Alignment (Pearson's r)" scaled from 0.00 to 0.20.
- **Legend**: Located on the right, mapping colors to model sizes:
- Purple: 14M
- Dark Blue: 70M
- Teal: 160M
- Darker Teal: 410M
- Green: 1B
- Lighter Green: 1.4B
- Yellow: 2.8B
- Light Yellow: 6.9B
- **Error Bars**: Black vertical lines atop each bar, representing standard deviation.
### Detailed Analysis
1. **128 Units Group**:
- **14M (Purple)**: ~0.16 (highest alignment)
- **70M (Dark Blue)**: ~0.15
- **160M (Teal)**: ~0.14
- **410M (Darker Teal)**: ~0.13
- **1B (Green)**: ~0.12
- **1.4B (Lighter Green)**: ~0.11
- **2.8B (Yellow)**: ~0.10
- **6.9B (Light Yellow)**: ~0.09
2. **1024 Units Group**:
- **14M (Purple)**: ~0.18
- **70M (Dark Blue)**: ~0.17
- **160M (Teal)**: ~0.16
- **410M (Darker Teal)**: ~0.15
- **1B (Green)**: ~0.14
- **1.4B (Lighter Green)**: ~0.13
- **2.8B (Yellow)**: ~0.12
- **6.9B (Light Yellow)**: ~0.11
3. **4096 Units Group**:
- **14M (Purple)**: ~0.19
- **70M (Dark Blue)**: ~0.18
- **160M (Teal)**: ~0.17
- **410M (Darker Teal)**: ~0.16
- **1B (Green)**: ~0.15
- **1.4B (Lighter Green)**: ~0.14
- **2.8B (Yellow)**: ~0.13
- **6.9B (Light Yellow)**: ~0.12
**Error Bar Variability**: Larger models (e.g., 6.9B) show longer error bars, indicating higher measurement uncertainty. Smaller models (e.g., 14M) have shorter error bars, suggesting more consistent results.
### Key Observations
1. **Inverse Relationship Between Model Size and Alignment**: Larger models (6.9B) consistently show lower alignment than smaller models (14M) within the same unit group.
2. **Unit Count Impact**: Alignment increases with more units (e.g., 128 → 4096 units), but the effect diminishes for larger models.
3. **Error Bar Trends**: Larger models exhibit greater variability in alignment scores, as seen in longer error bars.
### Interpretation
The data suggests that smaller models (14M) achieve higher brain alignment than larger models, even when scaled to the same number of units. This could indicate that smaller models generalize better or avoid overfitting. The positive correlation between unit count and alignment implies that increasing model capacity improves performance, but only up to a point—larger models may introduce complexity that reduces alignment. The error bars highlight that larger models are less reliable in their alignment measurements, possibly due to architectural complexity or training instability.