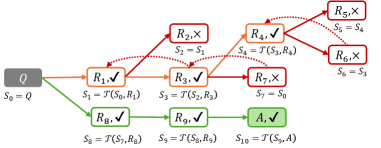
## Diagram: Decision Tree with Validation
### Overview
The image depicts a decision tree or flow diagram, illustrating a process with multiple branches and validation steps. Each node represents a state or decision point, and the arrows indicate the flow of the process. Some nodes are marked with a checkmark (✔), indicating successful validation, while others are marked with an "X", indicating failure. The diagram includes labels for each node and equations describing the transitions between states.
### Components/Axes
* **Nodes:** Represented as rounded rectangles, each labeled with "R" followed by a number (e.g., R1, R2) or "Q" or "A". Each node also contains either a checkmark (✔) or an "X".
* **Arrows:** Indicate the flow of the process. Solid arrows represent direct transitions, while dotted arrows represent feedback or alternative paths.
* **Labels:** Each node is labeled with a variable "S" followed by a number (e.g., S0, S1), and an equation that defines the value of that variable.
* **Colors:** The nodes and arrows are color-coded, with shades ranging from gray to orange to red, and green.
### Detailed Analysis
Here's a breakdown of the diagram, starting from the left:
1. **Starting Node:** A gray rounded rectangle labeled "Q" (top-left). The equation below it states "S0 = Q".
2. **First Branch:**
* A solid orange arrow leads from "Q" to a rounded rectangle labeled "R1, ✔". The equation below it states "S1 = T(S0, R1)".
* A solid green arrow leads from "Q" to a rounded rectangle labeled "R8, ✔". The equation below it states "S8 = T(S7, R8)".
3. **Second Level (Orange Branch):**
* A solid orange arrow leads from "R1, ✔" to "R3, ✔". The equation below it states "S3 = T(S2, R3)".
* A solid orange arrow leads from "R3, ✔" to "R7, X". The equation below it states "S7 = S0".
4. **Third Level (Orange Branch):**
* A solid red arrow leads from "R1, ✔" to "R2, X". The equation below it states "S2 = S1".
* A solid red arrow leads from "R3, ✔" to "R4, ✔". The equation below it states "S4 = T(S3, R4)".
5. **Fourth Level (Orange Branch):**
* A solid red arrow leads from "R4, ✔" to "R5, X". The equation below it states "S5 = S4".
* A solid red arrow leads from "R4, ✔" to "R6, X". The equation below it states "S6 = S3".
6. **Second Level (Green Branch):**
* A solid green arrow leads from "R8, ✔" to "R9, ✔". The equation below it states "S9 = T(S8, R9)".
7. **Third Level (Green Branch):**
* A solid green arrow leads from "R9, ✔" to "A, ✔". The equation below it states "S10 = T(S9, A)".
8. **Feedback Loops:**
* A dotted red arrow leads from "R2, X" to "R3, ✔".
* A dotted red arrow leads from "R5, X" to "R4, ✔".
* A dotted red arrow leads from "R6, X" to "R7, X".
### Key Observations
* The diagram represents a decision-making process with validation steps.
* The process starts with an initial state "Q" and branches into two paths.
* The orange path involves multiple validation steps, some of which fail (indicated by "X").
* The green path leads to a successful outcome "A, ✔".
* Feedback loops exist from failed validation states back to earlier stages in the orange path.
### Interpretation
The diagram illustrates a process where multiple attempts may be needed to reach a successful outcome. The orange path represents a more complex and potentially error-prone process, while the green path represents a more direct and successful route. The feedback loops suggest that the process can recover from failures by revisiting earlier stages and adjusting the input. The "T" function likely represents a transformation or processing step that depends on the input from the previous state and the current node. The diagram suggests that the process aims to reach a validated state, and it can do so through different paths, with some paths being more reliable than others.