## Chart Type: Multiple Line Graphs
### Overview
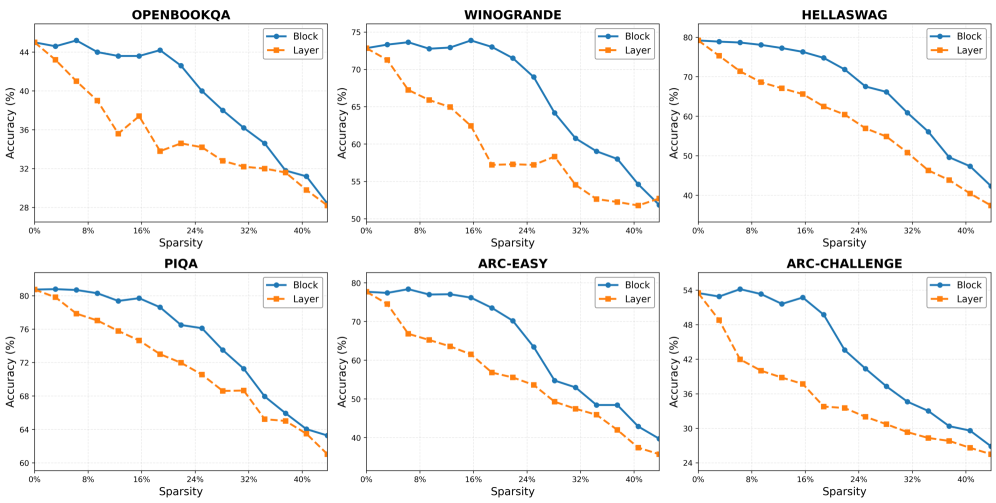
The image presents six line graphs arranged in a 2x3 grid. Each graph displays the relationship between "Sparsity" (x-axis) and "Accuracy (%)" (y-axis) for two different methods: "Block" and "Layer". The graphs are titled OPENBOOKQA, WINOGRANDE, HELLASWAG, PIQA, ARC-EASY, and ARC-CHALLENGE.
### Components/Axes
* **X-axis (Horizontal):** "Sparsity" ranging from 0% to 40% in increments of 8% (0%, 8%, 16%, 24%, 32%, 40%).
* **Y-axis (Vertical):** "Accuracy (%)". The range varies for each graph, but generally spans from approximately 25% to 80%.
* **Titles:** Each graph has a title indicating the dataset or task: OPENBOOKQA, WINOGRANDE, HELLASWAG, PIQA, ARC-EASY, ARC-CHALLENGE.
* **Legend:** Each graph includes a legend in the top-right corner:
* Blue line with circular markers: "Block"
* Orange dashed line with square markers: "Layer"
### Detailed Analysis
**1. OPENBOOKQA**
* **Y-axis:** Ranges from 28% to 44%.
* **Block (Blue):** Starts at approximately 44%, remains relatively stable until 8% sparsity, then gradually decreases to approximately 31% at 40% sparsity.
* (0%, 44%), (8%, 44%), (16%, 43.5%), (24%, 40%), (32%, 35%), (40%, 31%)
* **Layer (Orange):** Starts at approximately 44%, decreases sharply until 16% sparsity, fluctuates between 33% and 37% until 32% sparsity, then decreases to approximately 28% at 40% sparsity.
* (0%, 44%), (8%, 39%), (16%, 33%), (24%, 37%), (32%, 33%), (40%, 28%)
**2. WINOGRANDE**
* **Y-axis:** Ranges from 50% to 75%.
* **Block (Blue):** Starts at approximately 73%, remains relatively stable until 24% sparsity, then decreases to approximately 52% at 40% sparsity.
* (0%, 73%), (8%, 73%), (16%, 74%), (24%, 73%), (32%, 60%), (40%, 52%)
* **Layer (Orange):** Starts at approximately 72%, decreases until 24% sparsity, remains relatively stable until 32% sparsity, then decreases to approximately 52% at 40% sparsity.
* (0%, 72%), (8%, 68%), (16%, 63%), (24%, 57%), (32%, 58%), (40%, 52%)
**3. HELLASWAG**
* **Y-axis:** Ranges from 40% to 80%.
* **Block (Blue):** Starts at approximately 80%, gradually decreases to approximately 42% at 40% sparsity.
* (0%, 80%), (8%, 79%), (16%, 78%), (24%, 73%), (32%, 60%), (40%, 42%)
* **Layer (Orange):** Starts at approximately 79%, decreases to approximately 38% at 40% sparsity.
* (0%, 79%), (8%, 74%), (16%, 66%), (24%, 62%), (32%, 50%), (40%, 38%)
**4. PIQA**
* **Y-axis:** Ranges from 60% to 82%.
* **Block (Blue):** Starts at approximately 81%, gradually decreases to approximately 63% at 40% sparsity.
* (0%, 81%), (8%, 81%), (16%, 79%), (24%, 77%), (32%, 72%), (40%, 63%)
* **Layer (Orange):** Starts at approximately 80%, decreases to approximately 61% at 40% sparsity.
* (0%, 80%), (8%, 77%), (16%, 75%), (24%, 73%), (32%, 68%), (40%, 61%)
**5. ARC-EASY**
* **Y-axis:** Ranges from 40% to 80%.
* **Block (Blue):** Starts at approximately 78%, gradually decreases to approximately 40% at 40% sparsity.
* (0%, 78%), (8%, 78%), (16%, 76%), (24%, 72%), (32%, 53%), (40%, 40%)
* **Layer (Orange):** Starts at approximately 77%, decreases to approximately 36% at 40% sparsity.
* (0%, 77%), (8%, 69%), (16%, 64%), (24%, 57%), (32%, 50%), (40%, 36%)
**6. ARC-CHALLENGE**
* **Y-axis:** Ranges from 24% to 56%.
* **Block (Blue):** Starts at approximately 54%, gradually decreases to approximately 26% at 40% sparsity.
* (0%, 54%), (8%, 55%), (16%, 53%), (24%, 50%), (32%, 40%), (40%, 26%)
* **Layer (Orange):** Starts at approximately 54%, decreases to approximately 25% at 40% sparsity.
* (0%, 54%), (8%, 48%), (16%, 40%), (24%, 36%), (32%, 30%), (40%, 25%)
### Key Observations
* In all six graphs, both "Block" and "Layer" accuracy generally decreases as sparsity increases.
* The "Block" method tends to maintain a higher accuracy than the "Layer" method, especially at higher sparsity levels.
* The rate of accuracy decrease varies across different datasets/tasks. OPENBOOKQA and WINOGRANDE show a more stable accuracy for the "Block" method at lower sparsity levels compared to the other datasets.
### Interpretation
The graphs demonstrate the impact of sparsity on the accuracy of two different methods ("Block" and "Layer") across various datasets/tasks. The consistent downward trend in accuracy with increasing sparsity suggests that higher sparsity levels negatively affect model performance. The "Block" method generally outperforms the "Layer" method, indicating it is more robust to sparsity. The specific performance and sensitivity to sparsity vary depending on the dataset/task, highlighting the importance of considering the nature of the problem when applying sparsity techniques. The initial stability of the "Block" method in OPENBOOKQA and WINOGRANDE might suggest that these datasets are less sensitive to sparsity at lower levels, or that the "Block" method is particularly well-suited for these tasks in the presence of some sparsity.