\n
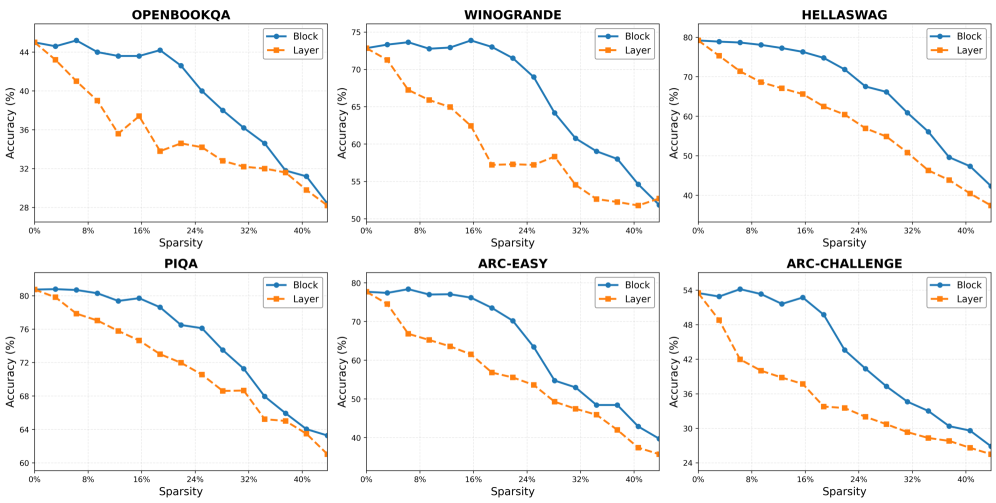
## Charts: Accuracy vs. Sparsity for Different Datasets
### Overview
The image presents six line charts, each depicting the relationship between accuracy (in percentage) and sparsity (in percentage) for different datasets. Each chart compares the accuracy of "Block" and "Layer" methods. The datasets are OPENBOOKQA, WINOGRANDE, HELLASWAG, PIQA, ARC-EASY, and ARC-CHALLENGE.
### Components/Axes
Each chart shares the following components:
* **X-axis:** Sparsity (%), ranging from 0% to 40%, with markers at 0%, 8%, 16%, 24%, 32%, and 40%.
* **Y-axis:** Accuracy (%), ranging from approximately 24% to 80%.
* **Legend:** Located in the top-right corner of each chart, distinguishing between "Block" (represented by a blue line with diamond markers) and "Layer" (represented by an orange line with square markers).
* **Title:** Each chart is labeled with the name of the dataset it represents.
### Detailed Analysis
**1. OPENBOOKQA:**
* **Block:** The blue line starts at approximately 43% accuracy at 0% sparsity, remains relatively stable until around 24% sparsity (approximately 43%), then declines sharply to approximately 28% accuracy at 40% sparsity.
* **Layer:** The orange line starts at approximately 43% accuracy at 0% sparsity, fluctuates slightly until around 24% sparsity (approximately 42%), and then declines steadily to approximately 30% accuracy at 40% sparsity.
**2. WINOGRANDE:**
* **Block:** The blue line starts at approximately 74% accuracy at 0% sparsity, decreases gradually to approximately 65% at 24% sparsity, and then declines sharply to approximately 51% accuracy at 40% sparsity.
* **Layer:** The orange line starts at approximately 72% accuracy at 0% sparsity, decreases steadily to approximately 55% at 24% sparsity, and then declines sharply to approximately 50% accuracy at 40% sparsity.
**3. HELLASWAG:**
* **Block:** The blue line starts at approximately 78% accuracy at 0% sparsity, decreases gradually to approximately 70% at 24% sparsity, and then declines sharply to approximately 44% accuracy at 40% sparsity.
* **Layer:** The orange line starts at approximately 75% accuracy at 0% sparsity, decreases steadily to approximately 60% at 24% sparsity, and then declines sharply to approximately 40% accuracy at 40% sparsity.
**4. PIQA:**
* **Block:** The blue line starts at approximately 81% accuracy at 0% sparsity, decreases gradually to approximately 75% at 24% sparsity, and then declines sharply to approximately 62% accuracy at 40% sparsity.
* **Layer:** The orange line starts at approximately 78% accuracy at 0% sparsity, decreases steadily to approximately 65% at 24% sparsity, and then declines sharply to approximately 60% accuracy at 40% sparsity.
**5. ARC-EASY:**
* **Block:** The blue line starts at approximately 76% accuracy at 0% sparsity, decreases gradually to approximately 65% at 24% sparsity, and then declines sharply to approximately 42% accuracy at 40% sparsity.
* **Layer:** The orange line starts at approximately 70% accuracy at 0% sparsity, decreases steadily to approximately 45% at 24% sparsity, and then declines sharply to approximately 35% accuracy at 40% sparsity.
**6. ARC-CHALLENGE:**
* **Block:** The blue line starts at approximately 54% accuracy at 0% sparsity, decreases gradually to approximately 45% at 24% sparsity, and then declines sharply to approximately 26% accuracy at 40% sparsity.
* **Layer:** The orange line starts at approximately 52% accuracy at 0% sparsity, decreases steadily to approximately 40% at 24% sparsity, and then declines sharply to approximately 24% accuracy at 40% sparsity.
### Key Observations
* In all datasets, both "Block" and "Layer" methods exhibit a general trend of decreasing accuracy as sparsity increases.
* The decline in accuracy is generally gradual up to around 24% sparsity, after which it becomes much steeper.
* The "Block" method consistently outperforms the "Layer" method across all datasets, especially at higher sparsity levels.
* The datasets exhibit varying levels of robustness to sparsity. WINOGRANDE, HELLASWAG, and PIQA show relatively higher initial accuracy and more gradual declines compared to OPENBOOKQA and ARC-CHALLENGE.
### Interpretation
The charts demonstrate the impact of sparsity on the accuracy of two different methods ("Block" and "Layer") across a range of question answering datasets. The consistent outperformance of the "Block" method suggests it is more resilient to the removal of parameters (induced by sparsity) than the "Layer" method. The steep decline in accuracy at higher sparsity levels indicates that beyond a certain point, removing parameters significantly degrades the model's ability to perform well. The varying robustness of different datasets suggests that some tasks are more sensitive to sparsity than others, potentially due to differences in the complexity of the reasoning required or the amount of information encoded in the model's parameters. These results are valuable for understanding the trade-offs between model size (sparsity) and performance, and for guiding the development of more efficient and robust question answering systems. The data suggests that while sparsity can reduce model size, it comes at a cost to accuracy, and the choice of method ("Block" vs. "Layer") can significantly impact the extent of this trade-off.