TECHNICAL ASSET FINGERPRINT
857148889434b6c344ba9d2b
Click to view fullscreen
Press ESC or click to close
FOUND IN PAPERS
EXPERT: gemma-3-27b-it-free VERSION 1
RUNTIME: google-free/gemma-3-27b-it
INTEL_VERIFIED
\n
## Line Chart: ΔP vs. Layer for Mistral Models
### Overview
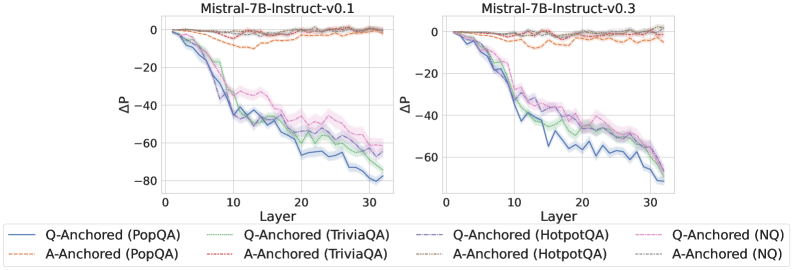
The image presents two line charts comparing the change in probability (ΔP) across layers for two versions of the Mistral-7B-Instruct model (v0.1 and v0.3). Each chart displays multiple lines representing different question-answering datasets and anchoring methods. The x-axis represents the layer number, ranging from 0 to approximately 32, while the y-axis represents ΔP, ranging from 0 to approximately -80.
### Components/Axes
* **X-axis:** Layer (0 to ~32)
* **Y-axis:** ΔP (Change in Probability, approximately -80 to 0)
* **Chart Titles:**
* Left Chart: "Mistral-7B-Instruct-v0.1"
* Right Chart: "Mistral-7B-Instruct-v0.3"
* **Legend:** Located at the bottom of the image, containing the following data series:
* Blue Line: Q-Anchored (PopQA)
* Orange Line: A-Anchored (PopQA)
* Green Line: Q-Anchored (TriviaQA)
* Purple Line: A-Anchored (TriviaQA)
* Brown Dashed Line: Q-Anchored (HotpotQA)
* Red Dashed Line: A-Anchored (HotpotQA)
* Teal Line: Q-Anchored (NQ)
* Peach Line: A-Anchored (NQ)
### Detailed Analysis or Content Details
**Left Chart (Mistral-7B-Instruct-v0.1):**
* **Q-Anchored (PopQA) - Blue Line:** Starts at approximately -2, decreases sharply to approximately -20 at layer 5, continues decreasing to approximately -65 at layer 25, and then decreases to approximately -75 at layer 32.
* **A-Anchored (PopQA) - Orange Line:** Starts at approximately -1, decreases to approximately -15 at layer 5, continues decreasing to approximately -60 at layer 25, and then decreases to approximately -70 at layer 32.
* **Q-Anchored (TriviaQA) - Green Line:** Starts at approximately -3, decreases to approximately -18 at layer 5, continues decreasing to approximately -60 at layer 25, and then decreases to approximately -70 at layer 32.
* **A-Anchored (TriviaQA) - Purple Line:** Starts at approximately -2, decreases to approximately -16 at layer 5, continues decreasing to approximately -55 at layer 25, and then decreases to approximately -65 at layer 32.
* **Q-Anchored (HotpotQA) - Brown Dashed Line:** Starts at approximately -1, decreases to approximately -10 at layer 5, continues decreasing to approximately -45 at layer 25, and then decreases to approximately -60 at layer 32.
* **A-Anchored (HotpotQA) - Red Dashed Line:** Starts at approximately -1, decreases to approximately -10 at layer 5, continues decreasing to approximately -40 at layer 25, and then decreases to approximately -55 at layer 32.
* **Q-Anchored (NQ) - Teal Line:** Starts at approximately -2, decreases to approximately -18 at layer 5, continues decreasing to approximately -60 at layer 25, and then decreases to approximately -70 at layer 32.
* **A-Anchored (NQ) - Peach Line:** Starts at approximately -1, decreases to approximately -15 at layer 5, continues decreasing to approximately -55 at layer 25, and then decreases to approximately -65 at layer 32.
**Right Chart (Mistral-7B-Instruct-v0.3):**
* **Q-Anchored (PopQA) - Blue Line:** Starts at approximately -1, decreases sharply to approximately -15 at layer 5, continues decreasing to approximately -55 at layer 25, and then decreases to approximately -70 at layer 32.
* **A-Anchored (PopQA) - Orange Line:** Starts at approximately -1, decreases to approximately -12 at layer 5, continues decreasing to approximately -50 at layer 25, and then decreases to approximately -60 at layer 32.
* **Q-Anchored (TriviaQA) - Green Line:** Starts at approximately -1, decreases to approximately -13 at layer 5, continues decreasing to approximately -50 at layer 25, and then decreases to approximately -60 at layer 32.
* **A-Anchored (TriviaQA) - Purple Line:** Starts at approximately -1, decreases to approximately -10 at layer 5, continues decreasing to approximately -45 at layer 25, and then decreases to approximately -55 at layer 32.
* **Q-Anchored (HotpotQA) - Brown Dashed Line:** Starts at approximately -1, decreases to approximately -8 at layer 5, continues decreasing to approximately -35 at layer 25, and then decreases to approximately -50 at layer 32.
* **A-Anchored (HotpotQA) - Red Dashed Line:** Starts at approximately -1, decreases to approximately -8 at layer 5, continues decreasing to approximately -30 at layer 25, and then decreases to approximately -45 at layer 32.
* **Q-Anchored (NQ) - Teal Line:** Starts at approximately -1, decreases to approximately -13 at layer 5, continues decreasing to approximately -50 at layer 25, and then decreases to approximately -60 at layer 32.
* **A-Anchored (NQ) - Peach Line:** Starts at approximately -1, decreases to approximately -10 at layer 5, continues decreasing to approximately -45 at layer 25, and then decreases to approximately -55 at layer 32.
### Key Observations
* All lines in both charts exhibit a generally downward trend, indicating a decreasing ΔP as the layer number increases.
* The Q-Anchored lines (blue, green, teal) generally have lower ΔP values than the A-Anchored lines (orange, purple, peach) across all datasets.
* The HotpotQA dataset (brown and red dashed lines) consistently shows the smallest decrease in ΔP compared to other datasets.
* The v0.3 model (right chart) shows a less steep decrease in ΔP compared to the v0.1 model (left chart), suggesting improved performance or stability in later layers.
### Interpretation
The charts illustrate how the change in probability (ΔP) evolves across the layers of the Mistral-7B-Instruct model for different question-answering datasets and anchoring methods. The negative ΔP values suggest a decrease in the model's confidence or probability as it processes information through deeper layers.
The difference between Q-Anchored and A-Anchored lines suggests that anchoring the question (Q) provides a more consistent and potentially more informative signal than anchoring the answer (A). The shallower slope for HotpotQA indicates that this dataset might be easier for the model to process or that the model has already learned relevant patterns from it.
The improvement in the v0.3 model, as evidenced by the less steep decline in ΔP, suggests that the model updates have resulted in a more stable and reliable representation of information across layers. This could be due to changes in the training data, model architecture, or optimization techniques.
The overall trend suggests that the model's initial confidence decreases as it processes information, but the extent of this decrease varies depending on the dataset and anchoring method. This information could be used to further refine the model's training process or to identify areas where the model struggles to maintain consistent performance.
DECODING INTELLIGENCE...