TECHNICAL ASSET FINGERPRINT
857148889434b6c344ba9d2b
Click to view fullscreen
Press ESC or click to close
FOUND IN PAPERS
EXPERT: healer-alpha-free VERSION 1
RUNTIME: free/openrouter/healer-alpha
INTEL_VERIFIED
## Dual Line Charts: Layer-wise ΔP for Mistral-7B-Instruct Models
### Overview
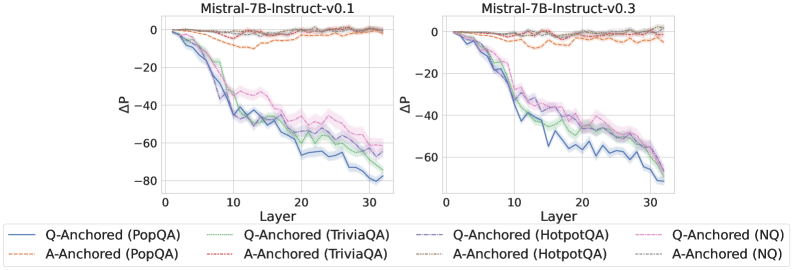
The image displays two side-by-side line charts comparing the layer-wise performance change (ΔP) for two versions of the Mistral-7B-Instruct model (v0.1 and v0.3) across four different question-answering datasets. Each chart plots ΔP against the model layer number (0 to 30). The data is split into two primary conditions: "Q-Anchored" and "A-Anchored" for each dataset.
### Components/Axes
* **Chart Titles:**
* Left Chart: `Mistral-7B-Instruct-v0.1`
* Right Chart: `Mistral-7B-Instruct-v0.3`
* **X-Axis (Both Charts):**
* Label: `Layer`
* Scale: Linear, from 0 to 30, with major ticks at 0, 10, 20, 30.
* **Y-Axis (Both Charts):**
* Label: `ΔP` (Delta P)
* Scale: Linear, from -80 to 0, with major ticks at -80, -60, -40, -20, 0.
* **Legend (Positioned below both charts):**
* Contains 8 entries, organized in two rows of four.
* **Row 1 (Q-Anchored):**
1. `Q-Anchored (PopQA)` - Solid blue line.
2. `Q-Anchored (TriviaQA)` - Solid green line.
3. `Q-Anchored (HotpotQA)` - Dashed purple line.
4. `Q-Anchored (NQ)` - Solid pink line.
* **Row 2 (A-Anchored):**
1. `A-Anchored (PopQA)` - Dashed orange line.
2. `A-Anchored (TriviaQA)` - Dashed red line.
3. `A-Anchored (HotpotQA)` - Dashed gray line.
4. `A-Anchored (NQ)` - Dashed light blue line.
### Detailed Analysis
**Chart 1: Mistral-7B-Instruct-v0.1**
* **Q-Anchored Series (All show a strong negative trend):**
* **Trend:** All four lines begin near ΔP=0 at Layer 0 and exhibit a steep, roughly linear decline as layer number increases.
* **PopQA (Blue, Solid):** Declines the most sharply. Approximate values: ~-40 at Layer 10, ~-65 at Layer 20, ending near -80 at Layer 30.
* **TriviaQA (Green, Solid):** Follows a similar path to PopQA but is slightly less negative. Approximate values: ~-35 at Layer 10, ~-60 at Layer 20, ending near -70 at Layer 30.
* **HotpotQA (Purple, Dashed):** Declines less steeply than PopQA/TriviaQA initially but converges with them at higher layers. Approximate values: ~-30 at Layer 10, ~-55 at Layer 20, ending near -65 at Layer 30.
* **NQ (Pink, Solid):** Shows the least negative trend among the Q-Anchored group. Approximate values: ~-25 at Layer 10, ~-50 at Layer 20, ending near -60 at Layer 30.
* **A-Anchored Series (All show minimal change, hovering near zero):**
* **Trend:** All four dashed lines remain relatively flat, fluctuating closely around the ΔP=0 baseline across all layers.
* **PopQA (Orange, Dashed):** Fluctuates between approximately +5 and -10.
* **TriviaQA (Red, Dashed):** Fluctuates between approximately +5 and -10.
* **HotpotQA (Gray, Dashed):** Fluctuates between approximately +5 and -5.
* **NQ (Light Blue, Dashed):** Fluctuates between approximately +5 and -5.
**Chart 2: Mistral-7B-Instruct-v0.3**
* **Q-Anchored Series (Trends are very similar to v0.1, with slightly more negative endpoints for some):**
* **Trend:** Consistent steep decline from Layer 0 to Layer 30.
* **PopQA (Blue, Solid):** Approximate values: ~-45 at Layer 10, ~-70 at Layer 20, ending near -80 at Layer 30.
* **TriviaQA (Green, Solid):** Approximate values: ~-40 at Layer 10, ~-65 at Layer 20, ending near -75 at Layer 30.
* **HotpotQA (Purple, Dashed):** Approximate values: ~-35 at Layer 10, ~-60 at Layer 20, ending near -70 at Layer 30.
* **NQ (Pink, Solid):** Approximate values: ~-30 at Layer 10, ~-55 at Layer 20, ending near -65 at Layer 30.
* **A-Anchored Series (Consistently flat near zero, similar to v0.1):**
* **Trend:** All lines show negligible change, staying within a narrow band around ΔP=0.
* **PopQA (Orange, Dashed):** Fluctuates between approximately +5 and -10.
* **TriviaQA (Red, Dashed):** Fluctuates between approximately +5 and -10.
* **HotpotQA (Gray, Dashed):** Fluctuates between approximately +5 and -5.
* **NQ (Light Blue, Dashed):** Fluctuates between approximately +5 and -5.
### Key Observations
1. **Dominant Pattern:** There is a stark, consistent dichotomy between the Q-Anchored and A-Anchored conditions across both model versions and all four datasets.
2. **Q-Anchored Degradation:** The Q-Anchored condition leads to a significant and progressive decrease in ΔP as the layer number increases, suggesting a cumulative negative effect through the model's layers.
3. **A-Anchored Stability:** The A-Anchored condition shows remarkable stability, with ΔP remaining near zero throughout all layers, indicating little to no layer-wise degradation.
4. **Dataset Hierarchy:** Within the Q-Anchored group, the magnitude of decline follows a consistent order across layers: PopQA (most negative) > TriviaQA > HotpotQA > NQ (least negative).
5. **Model Version Similarity:** The overall patterns and relationships between datasets are highly similar between Mistral-7B-Instruct-v0.1 and v0.3. The primary difference is that v0.3 shows slightly more negative ΔP values for the Q-Anchored series at equivalent layers.
### Interpretation
The data strongly suggests that the method of "anchoring" (likely referring to how information is presented or retrieved during inference) has a profound impact on the internal layer-wise performance metric (ΔP) of these language models.
* **Q-Anchored vs. A-Anchored:** The "Q-Anchored" approach (possibly anchoring on the Question) appears to cause a systematic degradation in the measured property (ΔP) as information propagates through the model's layers. In contrast, the "A-Anchored" approach (possibly anchoring on the Answer) maintains stability. This could imply that framing tasks around questions versus answers engages the model's internal processing in fundamentally different ways, with the question-centric approach leading to a form of cumulative "drift" or loss.
* **Layer-wise Progression:** The near-linear decline for Q-Anchored series indicates the effect is not localized but propagates and compounds through the network depth. This is a critical insight for understanding how different prompting or retrieval strategies affect internal representations.
* **Dataset Sensitivity:** The consistent hierarchy (PopQA > TriviaQA > HotpotQA > NQ) in the Q-Anchored decline suggests that the nature of the dataset (e.g., question complexity, answer specificity, knowledge type) modulates the severity of this layer-wise effect. PopQA, which shows the steepest decline, might represent a task type that is particularly disruptive under the Q-Anchored condition.
* **Model Robustness:** The similarity between v0.1 and v0.3 indicates this is a stable characteristic of the model architecture or training paradigm, not an artifact of a specific version. The slightly worse performance in v0.3 for Q-Anchored tasks could hint at a trade-off introduced during model updates.
In summary, this visualization provides clear evidence that the anchoring strategy is a major determinant of internal model dynamics, with question-anchored processing inducing a significant, layer-dependent negative shift in the ΔP metric across diverse knowledge-intensive tasks.
DECODING INTELLIGENCE...