## Line Chart: ΔP Across Layers for Mistral-7B-Instruct Models
### Overview
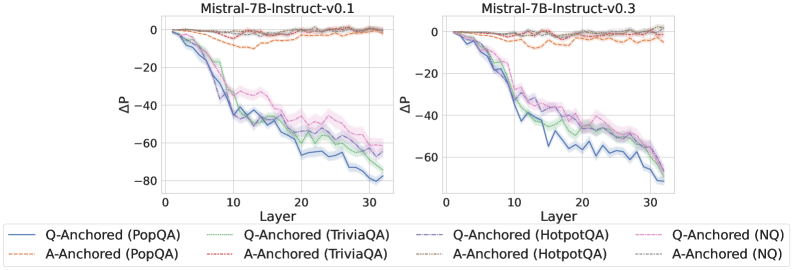
The image contains two side-by-side line charts comparing the ΔP metric across 30 layers of the Mistral-7B-Instruct model (versions v0.1 and v0.3). Each chart includes seven data series representing different anchoring methods (Q-Anchored and A-Anchored) across four datasets (PopQA, TriviaQA, HotpotQA, NQ). The charts show significant variation in ΔP values, with most lines trending downward as layer depth increases.
### Components/Axes
- **X-axis**: Layer (0 to 30, integer increments)
- **Y-axis**: ΔP (ranging from -80 to 0, with gridlines at -20, -40, -60)
- **Legends**:
- **Left Panel (v0.1)**:
- Blue solid: Q-Anchored (PopQA)
- Orange dashed: A-Anchored (PopQA)
- Green dotted: Q-Anchored (TriviaQA)
- Red dotted: A-Anchored (TriviaQA)
- Purple dash-dot: Q-Anchored (HotpotQA)
- Brown dashed: A-Anchored (HotpotQA)
- Pink dotted: Q-Anchored (NQ)
- **Right Panel (v0.3)**:
- Same legend structure as v0.1, but with updated line colors/patterns for version consistency
### Detailed Analysis
**Left Panel (v0.1)**:
1. **Q-Anchored (PopQA)**: Starts at 0, drops sharply to -60 by layer 10, then stabilizes with minor fluctuations.
2. **A-Anchored (PopQA)**: Begins at ~-5, declines gradually to -55 by layer 30.
3. **Q-Anchored (TriviaQA)**: Peaks at ~-10, declines to -65 by layer 30.
4. **A-Anchored (TriviaQA)**: Starts at ~-15, declines to -60 by layer 30.
5. **Q-Anchored (HotpotQA)**: Sharp drop to -70 by layer 10, then stabilizes.
6. **A-Anchored (HotpotQA)**: Gradual decline from ~-10 to -55.
7. **Q-Anchored (NQ)**: Starts at 0, declines to -75 by layer 30.
**Right Panel (v0.3)**:
1. **Q-Anchored (PopQA)**: Starts at 0, declines to -50 by layer 20, then stabilizes.
2. **A-Anchored (PopQA)**: Begins at ~-5, declines to -45 by layer 30.
3. **Q-Anchored (TriviaQA)**: Peaks at ~-10, declines to -55 by layer 30.
4. **A-Anchored (TriviaQA)**: Starts at ~-15, declines to -50 by layer 30.
5. **Q-Anchored (HotpotQA)**: Sharp drop to -60 by layer 10, then stabilizes.
6. **A-Anchored (HotpotQA)**: Gradual decline from ~-10 to -45.
7. **Q-Anchored (NQ)**: Starts at 0, declines to -65 by layer 30.
### Key Observations
1. **Version Comparison**: v0.3 shows less drastic declines in ΔP across most datasets compared to v0.1.
2. **Dataset Sensitivity**: HotpotQA consistently shows the steepest declines, suggesting higher sensitivity to anchoring methods.
3. **Anchoring Method Differences**: Q-Anchored methods generally exhibit steeper declines than A-Anchored counterparts.
4. **Layer Stability**: Both versions show stabilization after layer 20, with reduced volatility in deeper layers.
### Interpretation
The data suggests that anchoring methods (Q vs. A) significantly impact ΔP performance, with Q-Anchored approaches showing more pronounced declines. The v0.3 model demonstrates improved stability across datasets, particularly for HotpotQA, indicating potential architectural improvements. The consistent pattern of Q-Anchored methods underperforming compared to A-Anchored methods across datasets may reflect differences in how question vs. answer anchoring interacts with model architecture. The stabilization observed in deeper layers (post-layer 20) suggests that model performance converges or becomes less sensitive to anchoring strategies in later layers.