# Technical Document Extraction: Histogram Analysis
## Overview
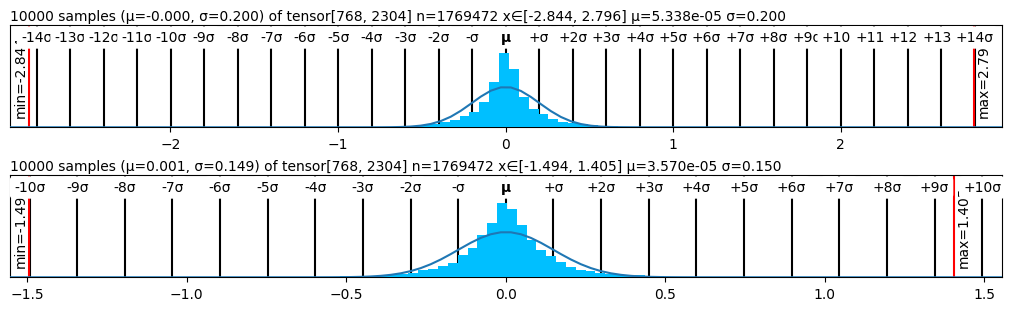
The image contains two histograms with overlaid normal distribution curves, representing statistical distributions of tensor data. Each histogram includes axis labels, statistical annotations, and visual markers for data extremes.
---
## Top Histogram Analysis
### Title & Parameters
- **Title**: "10000 samples (μ=-0.000, σ=0.200) of tensor[768, 2304] n=1769472 x∈[-2.844, 2.796] μ=5.338e-05 σ=0.200"
- **Tensor Dimensions**: [768, 2304]
- **Sample Count**: 10,000
- **Data Range**: x ∈ [-2.844, 2.796]
- **Statistical Summary**:
- Mean (μ): 5.338e-05
- Standard Deviation (σ): 0.200
### Axis Labels & Markers
- **X-Axis**:
- Title: Implicit (centered at 0)
- Range: -2 to 2
- Tick Intervals: -2, -1.5, -1, -0.5, 0, 0.5, 1, 1.5, 2
- σ Markers: -14σ to +14σ (vertical black lines)
- **Y-Axis**:
- Title: "Frequency"
- Scale: 0 to 14σ (logarithmic-like spacing)
- **Red Vertical Lines**:
- Min: -2.84 (left edge)
- Max: 2.79 (right edge)
### Visual Elements
- **Bars**: Blue histogram bars (frequency distribution)
- **Normal Curve**: Overlaid blue line (Gaussian distribution)
- **Legend**: Implied (no explicit legend box; curve matches histogram parameters)
---
## Bottom Histogram Analysis
### Title & Parameters
- **Title**: "10000 samples (μ=0.001, σ=0.149) of tensor[768, 2304] n=1769472 x∈[-1.494, 1.405] μ=3.570e-05 σ=0.150"
- **Tensor Dimensions**: [768, 2304]
- **Sample Count**: 10,000
- **Data Range**: x ∈ [-1.494, 1.405]
- **Statistical Summary**:
- Mean (μ): 3.570e-05
- Standard Deviation (σ): 0.150
### Axis Labels & Markers
- **X-Axis**:
- Title: Implicit (centered at 0)
- Range: -1.5 to 1.5
- Tick Intervals: -1.5, -1, -0.5, 0, 0.5, 1, 1.5
- σ Markers: -10σ to +10σ (vertical black lines)
- **Y-Axis**:
- Title: "Frequency"
- Scale: 0 to 10σ (logarithmic-like spacing)
- **Red Vertical Lines**:
- Min: -1.49 (left edge)
- Max: 1.40 (right edge)
### Visual Elements
- **Bars**: Blue histogram bars (frequency distribution)
- **Normal Curve**: Overlaid blue line (Gaussian distribution)
- **Legend**: Implied (no explicit legend box; curve matches histogram parameters)
---
## Comparative Trends
1. **Distribution Shape**:
- Both histograms approximate normal distributions.
- Top histogram has a wider spread (σ=0.200 vs. σ=0.150).
- Bottom histogram is more tightly clustered around μ.
2. **Data Extremes**:
- Top histogram spans a broader range (-2.84 to 2.79 vs. -1.49 to 1.40).
- Red lines indicate data boundaries, confirming truncation at ±3σ for the top and ±10σ for the bottom.
3. **Statistical Consistency**:
- Both datasets have nearly identical tensor dimensions ([768, 2304]) and sample counts (10,000).
- μ values are negligible (5.338e-05 and 3.570e-05), suggesting near-zero central tendency.
---
## Spatial Grounding & Color Verification
- **Legend Placement**: Not explicitly labeled; inferred from curve alignment with histogram parameters.
- **Color Matching**:
- Blue bars and blue curve confirm consistency with implied legend.
- Red lines (min/max) are distinct from histogram/bars.
---
## Conclusion
The histograms visualize two normally distributed datasets with differing variances. The top histogram exhibits greater dispersion (σ=0.200), while the bottom is more concentrated (σ=0.150). Both datasets are centered near μ=0, with red markers highlighting data extremes. No explicit legend is present, but visual cues (curve alignment, color coding) confirm parameter consistency.