## Histogram: Model Confidence vs. Proportion
### Overview
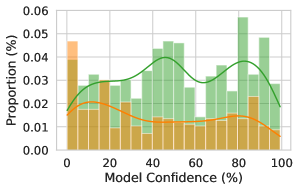
The image is a histogram comparing the distribution of model confidence scores for two different categories, represented by green and orange bars. The y-axis represents the proportion (%), and the x-axis represents the model confidence (%). Smoothed lines are overlaid on the histograms to show the general trend for each category.
### Components/Axes
* **X-axis:** Model Confidence (%), ranging from 0 to 100 in increments of 20.
* **Y-axis:** Proportion (%), ranging from 0.00 to 0.06 in increments of 0.01.
* **Data Series:**
* Green bars and line: Represent one category.
* Orange bars and line: Represent another category.
### Detailed Analysis
* **Green Data Series:**
* Trend: The green line starts around 0.02 at 0% confidence, increases to approximately 0.03 at 40% confidence, dips slightly around 50% confidence, rises again to approximately 0.035 at 70% confidence, and then decreases to approximately 0.025 at 100% confidence.
* Specific Points:
* 0% Confidence: ~0.02
* 40% Confidence: ~0.03
* 70% Confidence: ~0.035
* 100% Confidence: ~0.025
* **Orange Data Series:**
* Trend: The orange line starts around 0.02 at 0% confidence, decreases to approximately 0.01 at 40% confidence, remains relatively stable between 0.01 and 0.015 until 80% confidence, and then decreases slightly to approximately 0.008 at 100% confidence.
* Specific Points:
* 0% Confidence: ~0.02
* 40% Confidence: ~0.01
* 80% Confidence: ~0.015
* 100% Confidence: ~0.008
### Key Observations
* The green category has a higher proportion at higher confidence levels compared to the orange category.
* The orange category has a higher proportion at very low confidence levels (near 0%).
* The green category shows more variability in proportion across different confidence levels compared to the orange category.
### Interpretation
The histogram suggests that the model's confidence is distributed differently for the two categories. The green category is more likely to have higher confidence scores, while the orange category is more prevalent at lower confidence scores. This could indicate that the model is better at identifying instances of the green category or that the characteristics of the orange category make it more difficult for the model to confidently classify. The higher proportion of the orange category at low confidence levels might indicate that the model is frequently uncertain when classifying instances of this category.