## Bar Chart: Model Confidence vs. Prediction Accuracy
### Overview
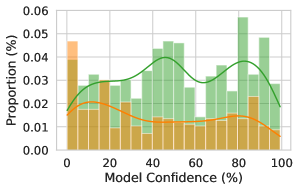
The chart visualizes the relationship between model confidence (x-axis) and prediction accuracy (y-axis) through two data series: green bars representing "Correct Predictions" and an orange line representing "Incorrect Predictions." The y-axis shows proportion (%) from 0 to 0.06, while the x-axis spans model confidence (%) from 0 to 100.
### Components/Axes
- **X-axis**: Model Confidence (%)
- Scale: 0 to 100 in 20-unit increments
- Labels: "0", "20", "40", "60", "80", "100"
- **Y-axis**: Proportion (%)
- Scale: 0 to 0.06 in 0.01 increments
- Labels: "0.00", "0.01", "0.02", "0.03", "0.04", "0.05", "0.06"
- **Legend**:
- Top-right corner
- Green: "Correct Predictions"
- Orange: "Incorrect Predictions"
### Detailed Analysis
1. **Green Bars (Correct Predictions)**:
- Clustered between 20% and 80% confidence.
- Peak at ~50% confidence with a proportion of ~0.05.
- Secondary peak at ~80-90% confidence (~0.04 proportion).
- Gradual decline after 60% confidence.
2. **Orange Line (Incorrect Predictions)**:
- Peaks at ~80% confidence with a proportion of ~0.04.
- Gradual rise from 0% to 80% confidence.
- Sharp decline after 80% confidence.
### Key Observations
- **Bimodal Distribution**: Correct predictions show two peaks (50% and 80-90% confidence), suggesting the model is most accurate at moderate and high confidence levels.
- **Inverse Relationship at High Confidence**: Incorrect predictions peak at 80% confidence, indicating overconfidence in predictions beyond this threshold.
- **Low Confidence Bias**: Proportions for both series are lowest at 0% confidence (~0.01 for correct, ~0.005 for incorrect).
### Interpretation
The data reveals a non-linear relationship between model confidence and accuracy. While the model achieves highest correctness at 50% confidence, its predictions become increasingly unreliable at very high confidence levels (80%+), where incorrect predictions dominate. This suggests potential issues with model calibration—high confidence does not guarantee accuracy. The secondary peak in correct predictions at 80-90% confidence may reflect a subset of "truly confident" predictions that are accurate, but the overall trend highlights the need for better alignment between confidence scores and actual performance. The inverse relationship at high confidence underscores the risk of over-reliance on the model’s self-assessed certainty.