\n
## Diagram: Ant Colony Path
### Overview
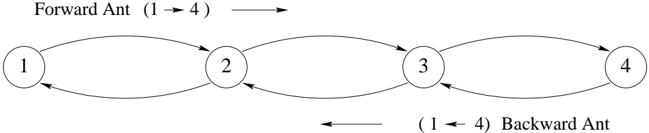
The image depicts a diagram representing a path traveled by an ant colony, specifically illustrating forward and backward movement between four nodes labeled 1 through 4. The diagram uses circles to represent nodes and curved arrows to represent the paths between them.
### Components/Axes
The diagram consists of:
* **Nodes:** Four circular nodes labeled 1, 2, 3, and 4, arranged horizontally.
* **Arrows:** Curved arrows indicating the direction of travel. There are two sets of arrows:
* "Forward Ant (1 → 4)" - Arrows pointing from left to right, indicating movement from node 1 to node 4.
* "Backward Ant (1 ← 4)" - Arrows pointing from right to left, indicating movement from node 4 to node 1.
* **Labels:**
* "Forward Ant (1 → 4)" - Located at the top-right of the diagram.
* "(1 ← 4) Backward Ant" - Located at the bottom-left of the diagram.
### Detailed Analysis or Content Details
The diagram shows a cyclical path. The forward ant path proceeds as follows:
* Node 1 to Node 2
* Node 2 to Node 3
* Node 3 to Node 4
The backward ant path proceeds as follows:
* Node 4 to Node 3
* Node 3 to Node 2
* Node 2 to Node 1
The arrows indicate bidirectional travel between each pair of adjacent nodes. For example, there is an arrow from Node 1 to Node 2 *and* an arrow from Node 2 to Node 1.
### Key Observations
The diagram illustrates a closed loop or cycle. The ants can travel in either direction along the path. The labeling explicitly defines the direction of travel as "Forward" or "Backward" relative to the sequence 1 to 4.
### Interpretation
This diagram likely represents a simplified model of ant colony behavior, specifically pheromone trail formation and following. Ants deposit pheromones as they travel, and other ants are more likely to follow paths with stronger pheromone concentrations. The forward and backward paths represent ants reinforcing the trail in both directions. The cyclical nature suggests that the ants are continuously traversing the path, potentially searching for food or resources. The diagram doesn't provide quantitative data (e.g., pheromone levels, ant density), but it visually demonstrates the concept of bidirectional travel and trail reinforcement in an ant colony. The diagram is a conceptual illustration rather than a data-driven representation.