## Network Diagram: Bipartite Graph with Weighted Connections
### Overview
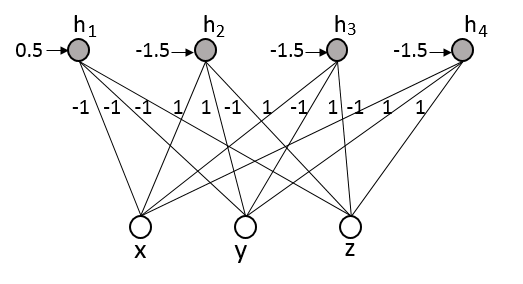
The image depicts a bipartite graph with two distinct layers of nodes. The top layer contains four nodes labeled **h₁, h₂, h₃, h₄**, each with an incoming arrow. The bottom layer contains three nodes labeled **x, y, z**. All nodes in the bottom layer are fully connected to all nodes in the top layer via directed edges labeled with numerical weights.
### Components/Axes
- **Nodes**:
- **Top Layer (h₁–h₄)**:
- Each node has an incoming arrow with a numerical label:
- **h₁**: `0.5`
- **h₂**: `-1.5`
- **h₃**: `-1.5`
- **h₄**: `-1.5`
- **Bottom Layer (x, y, z)**:
- No incoming arrows; act as source nodes.
- **Edges**:
- Directed from bottom-layer nodes (x, y, z) to top-layer nodes (h₁–h₄).
- Edge weights are explicitly labeled:
- **-1** (negative weight)
- **1** (positive weight)
- **-1.5** (strong negative weight)
- **0.5** (weak positive weight)
### Detailed Analysis
1. **Edge Weights**:
- **h₁**:
- x → h₁: `-1`
- y → h₁: `-1`
- z → h₁: `-1`
- **h₂**:
- x → h₂: `-1`
- y → h₂: `1`
- z → h₂: `-1`
- **h₃**:
- x → h₃: `1`
- y → h₃: `-1`
- z → h₃: `1`
- **h₄**:
- x → h₄: `1`
- y → h₄: `1`
- z → h₄: `1`
- **Incoming Arrows on h₁–h₄**:
- These likely represent **biases** or **initial activation values** for the top-layer nodes.
2. **Spatial Grounding**:
- **Top Layer (h₁–h₄)**: Positioned at the top of the diagram, with arrows pointing toward them from the bottom layer.
- **Bottom Layer (x, y, z)**: Positioned at the bottom, with edges radiating upward to the top layer.
- **Edge Labels**: Placed near the midpoint of each edge, with arrows indicating directionality.
3. **Legend/Annotations**:
- No explicit legend is present, but edge weights are directly annotated on the graph.
### Key Observations
- **Symmetry in Connections**: Each bottom-layer node (x, y, z) connects to all top-layer nodes (h₁–h₄), forming a fully connected bipartite structure.
- **Weight Patterns**:
- **h₁** receives uniformly negative weights (`-1`) from all bottom-layer nodes, suggesting inhibitory influence.
- **h₂, h₃, h₄** have mixed weights, indicating a balance of excitatory (`1`) and inhibitory (`-1`, `-1.5`) inputs.
- The incoming arrow values for h₁–h₄ (`0.5`, `-1.5`, `-1.5`, `-1.5`) suggest **asymmetric initialization** or **bias terms**.
- **Outliers**:
- The `-1.5` weights on h₂, h₃, and h₄ edges are stronger in magnitude than other weights, indicating heightened sensitivity to specific inputs.
### Interpretation
This diagram likely represents a **neural network layer** or **weighted decision model**:
- **Bottom Layer (x, y, z)**: Input features or variables.
- **Top Layer (h₁–h₄)**: Hidden units or decision nodes.
- **Edge Weights**: Determine the strength and direction of influence from inputs to hidden units. Negative weights (`-1`, `-1.5`) imply **inhibition**, while positive weights (`1`, `0.5`) imply **excitation**.
- **Incoming Arrows on h₁–h₄**: These values (`0.5`, `-1.5`) may act as **biases**, offsetting the weighted sum of inputs to produce the final activation of each hidden node.
The structure suggests a system where inputs (x, y, z) are processed through a weighted combination to generate outputs (h₁–h₄), with biases fine-tuning the results. The asymmetry in weights and biases highlights potential nonlinear behavior or prioritization of certain inputs over others.