## Histogram Grid: Neuron Activation Distributions
### Overview
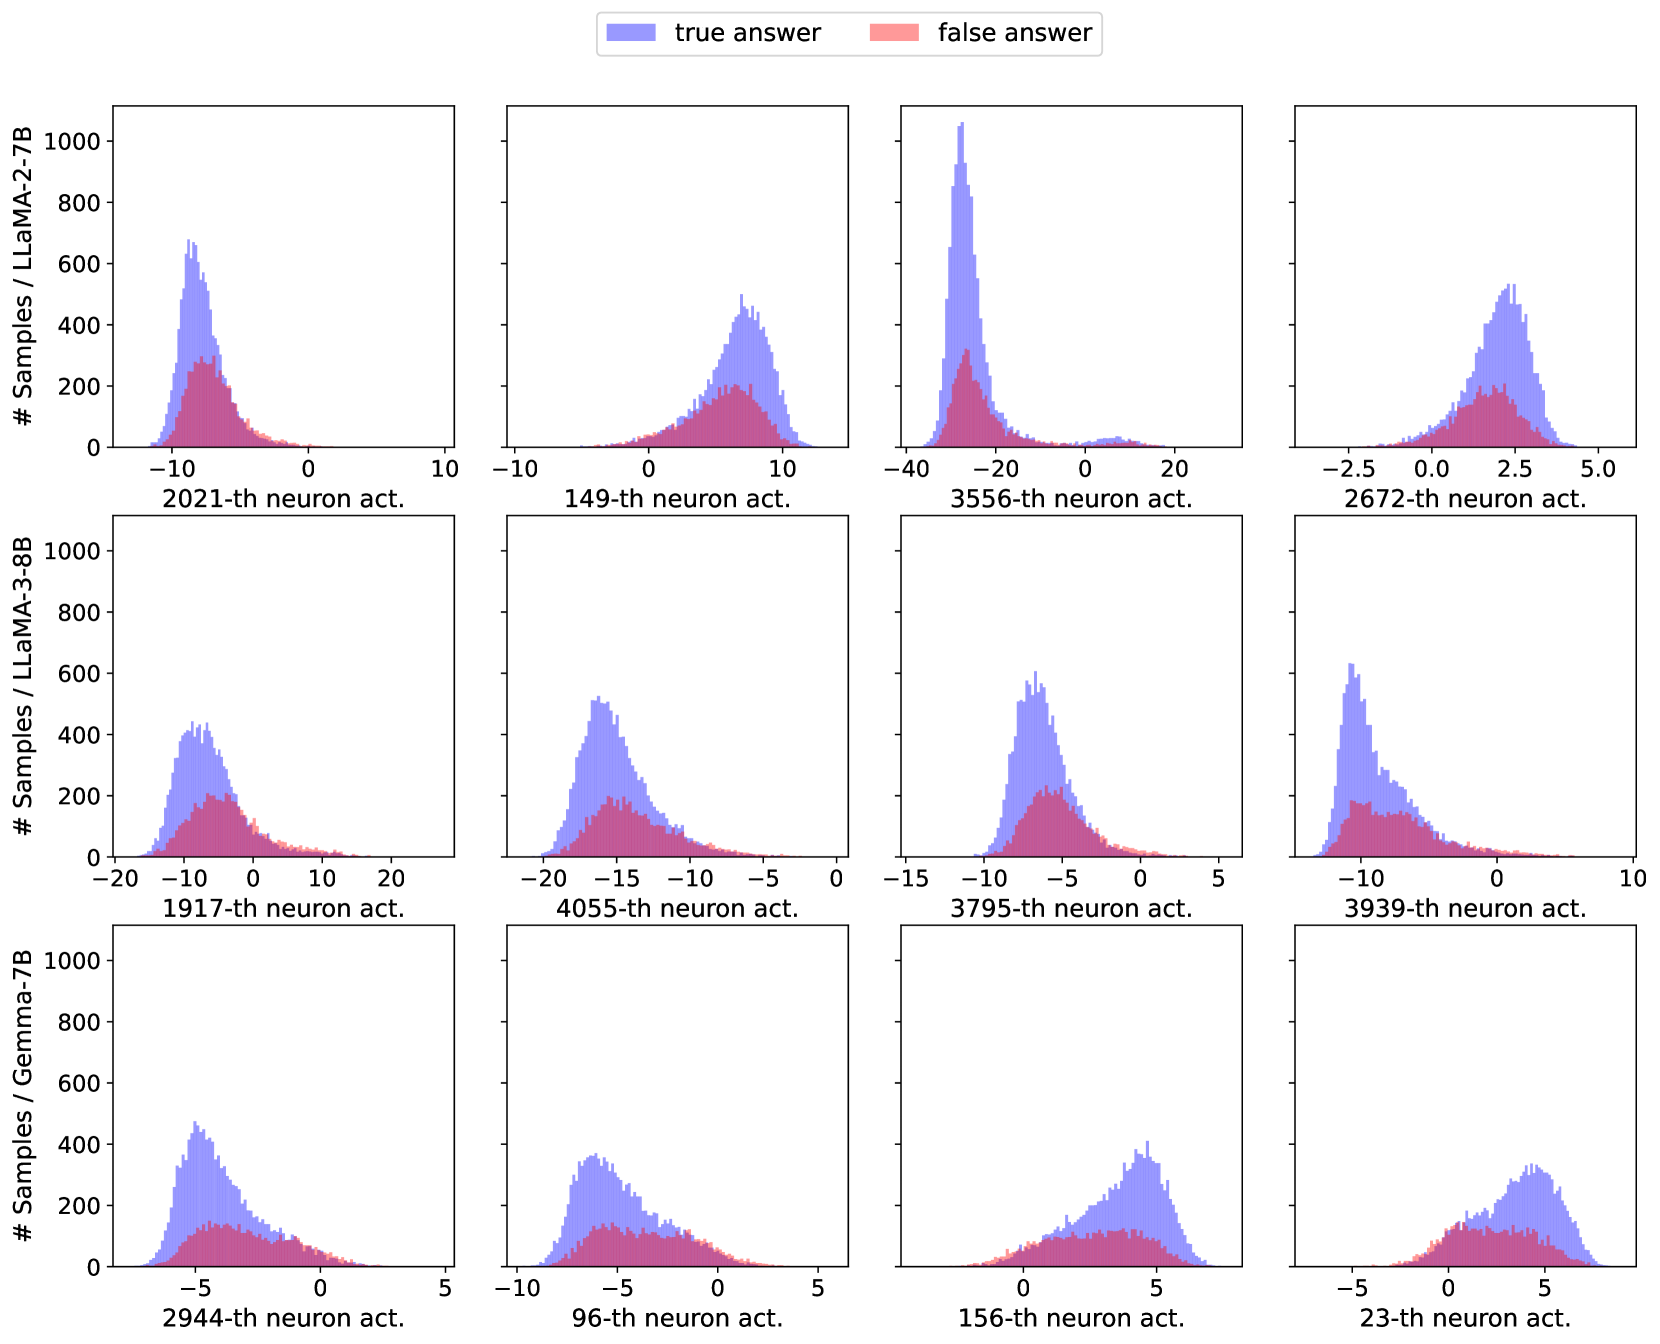
The image presents a grid of 12 histograms, arranged in a 3x4 matrix. Each histogram visualizes the distribution of neuron activations for a specific neuron in different language models (LLaMA-2-7B, LLaMA-3-8B, and Gemma-7B). The histograms compare the activation distributions for "true answer" and "false answer" scenarios, represented by blue and red bars, respectively.
### Components/Axes
* **Title:** None explicitly provided for the entire figure, but each subplot has a title indicating the neuron number and "neuron act." (neuron activation).
* **X-axis:** Represents the neuron activation value. The range varies across subplots, but generally spans a range of approximately -20 to +20.
* **Y-axis:** Represents the number of samples. The scale is consistent across the first two rows, ranging from 0 to 1000. The third row also ranges from 0 to 1000.
* **Legend:** Located at the top of the image.
* Blue: "true answer"
* Red: "false answer"
* **Y-axis Label:** "# Samples / LLaMA-2-7B" for the first row, "# Samples / LLaMA-3-8B" for the second row, and "# Samples / Gemma-7B" for the third row.
### Detailed Analysis
Here's a breakdown of each subplot, including the neuron number, model, and a description of the distributions:
**Row 1: LLaMA-2-7B**
* **Plot 1:** 2021-th neuron act.
* X-axis: Approximately -10 to 10.
* True answer (blue): Peaks around -8, with a sharp drop-off towards 0 and a long tail to the right. Max value ~700.
* False answer (red): Peaks around -5, with a broader distribution extending to the right. Max value ~300.
* **Plot 2:** 149-th neuron act.
* X-axis: Approximately -10 to 10.
* True answer (blue): Peaks around 5, with a long tail to the left. Max value ~500.
* False answer (red): Peaks around 5, with a smaller distribution. Max value ~200.
* **Plot 3:** 3556-th neuron act.
* X-axis: Approximately -40 to 20.
* True answer (blue): Peaks around -25, with a sharp drop-off towards 0 and a long tail to the right. Max value ~900.
* False answer (red): Peaks around -20, with a broader distribution extending to the right. Max value ~300.
* **Plot 4:** 2672-th neuron act.
* X-axis: Approximately -2.5 to 5.0.
* True answer (blue): Peaks around 2.5, with a long tail to the left. Max value ~500.
* False answer (red): Peaks around 2.5, with a smaller distribution. Max value ~200.
**Row 2: LLaMA-3-8B**
* **Plot 5:** 1917-th neuron act.
* X-axis: Approximately -20 to 20.
* True answer (blue): Peaks around -10, with a long tail to the right. Max value ~400.
* False answer (red): Peaks around -5, with a broader distribution extending to the right. Max value ~200.
* **Plot 6:** 4055-th neuron act.
* X-axis: Approximately -20 to 0.
* True answer (blue): Peaks around -15, with a long tail to the right. Max value ~400.
* False answer (red): Peaks around -10, with a broader distribution extending to the right. Max value ~200.
* **Plot 7:** 3795-th neuron act.
* X-axis: Approximately -15 to 5.
* True answer (blue): Peaks around -8, with a long tail to the right. Max value ~500.
* False answer (red): Peaks around -5, with a broader distribution extending to the right. Max value ~200.
* **Plot 8:** 3939-th neuron act.
* X-axis: Approximately -10 to 10.
* True answer (blue): Peaks around -5, with a long tail to the right. Max value ~400.
* False answer (red): Peaks around -2, with a broader distribution extending to the right. Max value ~200.
**Row 3: Gemma-7B**
* **Plot 9:** 2944-th neuron act.
* X-axis: Approximately -5 to 5.
* True answer (blue): Peaks around -2, with a long tail to the right. Max value ~400.
* False answer (red): Peaks around -1, with a broader distribution extending to the right. Max value ~200.
* **Plot 10:** 96-th neuron act.
* X-axis: Approximately -10 to 5.
* True answer (blue): Peaks around -5, with a long tail to the right. Max value ~400.
* False answer (red): Peaks around -2, with a broader distribution extending to the right. Max value ~200.
* **Plot 11:** 156-th neuron act.
* X-axis: Approximately -5 to 5.
* True answer (blue): Peaks around 2, with a long tail to the left. Max value ~400.
* False answer (red): Peaks around 3, with a broader distribution extending to the left. Max value ~200.
* **Plot 12:** 23-th neuron act.
* X-axis: Approximately -5 to 5.
* True answer (blue): Peaks around 2, with a long tail to the left. Max value ~400.
* False answer (red): Peaks around 3, with a broader distribution extending to the left. Max value ~200.
### Key Observations
* The distributions of neuron activations differ significantly between "true answer" and "false answer" scenarios.
* The "true answer" distributions tend to have sharper peaks, while the "false answer" distributions are broader.
* The activation ranges vary across different neurons.
* The LLaMA-2-7B model seems to have a wider range of activation values compared to LLaMA-3-8B and Gemma-7B.
* The number of samples is consistent across all plots, allowing for direct comparison of the distributions.
### Interpretation
The histograms provide insights into how different neurons in the language models respond to "true" and "false" answers. The distinct distributions suggest that these neurons play a role in distinguishing between correct and incorrect responses. The sharper peaks in the "true answer" distributions may indicate a more focused and specific activation pattern when the model is providing a correct answer. The broader "false answer" distributions could reflect a more diffuse or less certain activation pattern when the model is making a mistake. The differences in activation ranges and distributions across different neurons highlight the diverse roles that individual neurons play in the overall functioning of the language models. Comparing the distributions across the three models (LLaMA-2-7B, LLaMA-3-8B, and Gemma-7B) could reveal differences in their internal representations and processing strategies.