TECHNICAL ASSET FINGERPRINT
859351cd944d09f49d15316e
Click to view fullscreen
Press ESC or click to close
FOUND IN PAPERS
EXPERT: healer-alpha-free VERSION 1
RUNTIME: free/openrouter/healer-alpha
INTEL_VERIFIED
\n
## Histogram Grid: Neuron Activation Distributions by Model and Neuron Index
### Overview
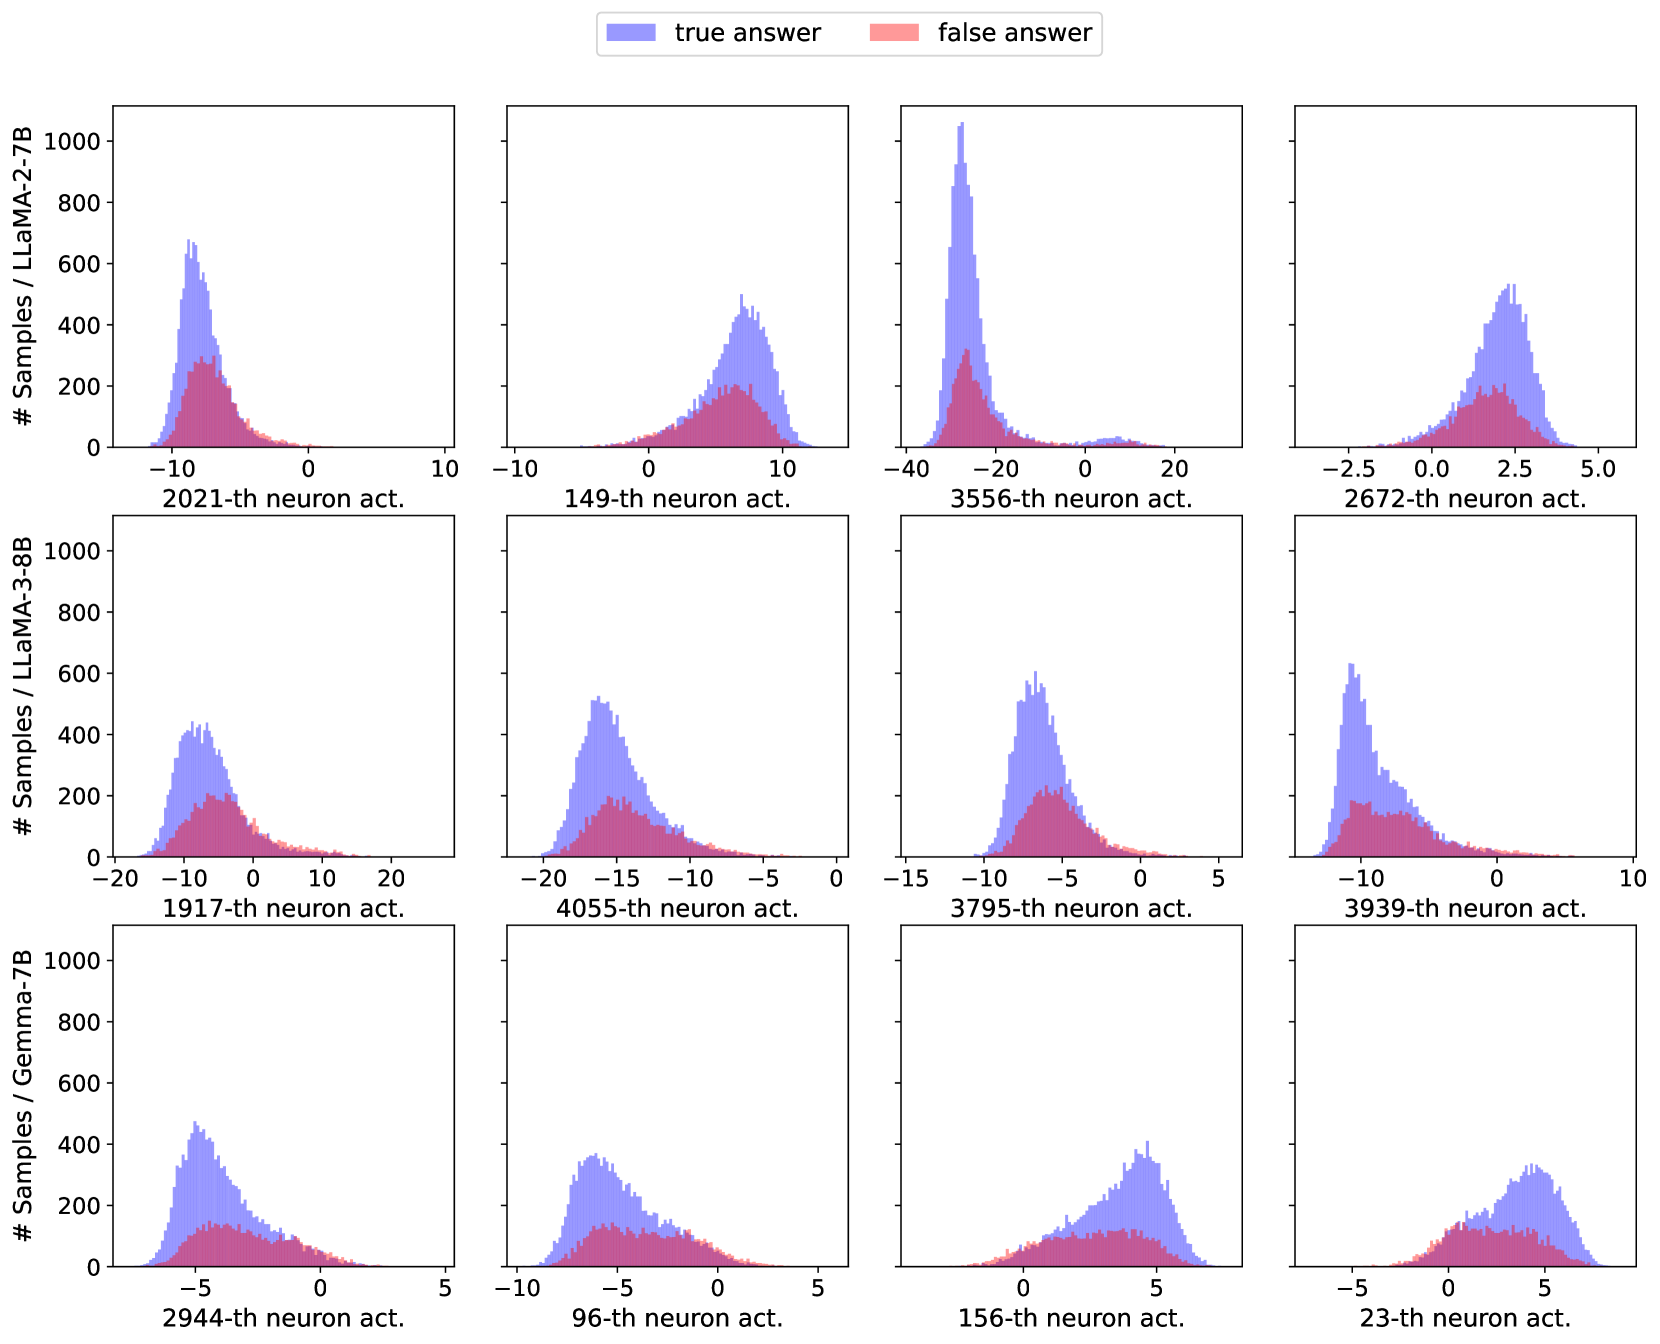
The image displays a 3x4 grid of histograms, each showing the distribution of activation values for a specific neuron within a specific large language model (LLM). The distributions are split into two categories: activations associated with "true answers" (blue) and "false answers" (red). The purpose is to visualize how the activation patterns of individual neurons differ based on the correctness of the model's output.
### Components/Axes
* **Legend:** Located at the top center. It defines two data series:
* **Blue:** "true answer"
* **Red:** "false answer"
* **Y-Axis (Shared per row):** Labeled "# Samples / [Model Name]". The scale is consistent within each row, ranging from 0 to 1000, with tick marks at 0, 200, 400, 600, 800, and 1000. This represents the count of samples falling into each activation bin.
* **X-Axis (Per subplot):** Labeled with the specific neuron index being analyzed (e.g., "2021-th neuron act."). The numerical scale and range vary significantly between subplots.
* **Row Labels (Left side):** Identify the model for each row of histograms:
* **Top Row:** LLaMA-2-7B
* **Middle Row:** LLaMA-3-8B
* **Bottom Row:** Gemma-7B
### Detailed Analysis
The grid is processed row by row, from left to right.
**Row 1: LLaMA-2-7B**
1. **Top-Left (Neuron 2021):** X-axis range approx. -15 to 5. Both distributions are centered around -8. The "true answer" (blue) distribution has a much higher peak (~650 samples) compared to the "false answer" (red, ~300 samples). The distributions overlap heavily.
2. **Top-Center-Left (Neuron 149):** X-axis range approx. -10 to 15. Distributions are centered around +7. Blue peak (~500) is higher than red peak (~200). Significant overlap.
3. **Top-Center-Right (Neuron 3556):** X-axis range approx. -40 to 30. A very sharp, high peak for "true answer" (blue) centered near -30, reaching over 1000 samples. The "false answer" (red) distribution is much lower and broader, centered around -25 with a peak of ~300. This shows the strongest separation between classes in this row.
4. **Top-Right (Neuron 2672):** X-axis range approx. -3 to 6. Distributions centered around +2.5. Blue peak (~550) is higher than red peak (~200). Substantial overlap.
**Row 2: LLaMA-3-8B**
1. **Middle-Left (Neuron 1917):** X-axis range approx. -20 to 20. Distributions centered around -8. Blue peak (~450) is higher than red peak (~200). Overlap is significant.
2. **Middle-Center-Left (Neuron 4055):** X-axis range approx. -20 to 0. Distributions centered around -16. Blue peak (~500) is higher than red peak (~200). Overlap is significant.
3. **Middle-Center-Right (Neuron 3795):** X-axis range approx. -15 to 5. Distributions centered around -7. Blue peak (~600) is higher than red peak (~200). Overlap is significant.
4. **Middle-Right (Neuron 3939):** X-axis range approx. -15 to 10. Distributions centered around -10. Blue peak (~650) is higher than red peak (~200). Overlap is significant.
**Row 3: Gemma-7B**
1. **Bottom-Left (Neuron 2944):** X-axis range approx. -8 to 5. Distributions centered around -4. Blue peak (~450) is higher than red peak (~150). Overlap is significant.
2. **Bottom-Center-Left (Neuron 96):** X-axis range approx. -10 to 5. Distributions centered around -6. Blue peak (~350) is higher than red peak (~150). Overlap is significant.
3. **Bottom-Center-Right (Neuron 156):** X-axis range approx. -2 to 8. Distributions centered around +4. Blue peak (~400) is higher than red peak (~200). Overlap is significant.
4. **Bottom-Right (Neuron 23):** X-axis range approx. -6 to 8. Distributions centered around +4. Blue peak (~350) is higher than red peak (~200). Overlap is significant.
### Key Observations
1. **Consistent Pattern:** In all 12 histograms, the distribution for "true answer" (blue) has a higher peak (more samples concentrated around the mode) than the distribution for "false answer" (red).
2. **Overlap:** There is substantial overlap between the blue and red distributions in nearly all cases, indicating that the activation value of a single neuron is not a perfect classifier for answer correctness.
3. **Outlier - Strong Separation:** The histogram for **LLaMA-2-7B, Neuron 3556** (top row, third from left) is a notable exception. It shows a very sharp, high peak for true answers at a much lower activation value (~-30) compared to the broader, lower distribution for false answers. This suggests this specific neuron may be a particularly strong indicator for this model.
4. **Activation Range Variability:** The optimal activation range (where the peak occurs) varies widely across neurons and models, from negative values (e.g., -30 for LLaMA-2-7B Neuron 3556) to positive values (e.g., +7 for LLaMA-2-7B Neuron 149).
5. **Model Comparison:** The distributions for LLaMA-3-8B (middle row) appear slightly more consistent in shape and separation across the four sampled neurons compared to the other two models.
### Interpretation
This visualization is likely from a mechanistic interpretability study aiming to understand how internal neural activations correlate with model performance. The data suggests that:
* **Neurons as Features:** Individual neurons can act as features whose activation strength carries information about the correctness of the model's output. The consistent pattern of higher peaks for true answers implies these neurons are more reliably or strongly activated in correct response scenarios.
* **Distributed Representation:** The significant overlap in most plots indicates that correctness is not encoded by a single neuron in an "on/off" manner. Instead, it is likely represented in a distributed fashion across many neurons, where the combined pattern of activations is more informative than any single value.
* **Specialized Neurons:** The outlier case (LLaMA-2-7B, Neuron 3556) demonstrates that some neurons may become highly specialized for detecting conditions leading to correct or incorrect outputs, showing a clearer separation in their activation distributions.
* **Model-Specific Internals:** The differences in activation ranges and distribution shapes between LLaMA-2, LLaMA-3, and Gemma highlight that different models develop distinct internal representations, even when performing similar tasks. This has implications for model comparison and the transfer of interpretability findings.
In summary, the image provides empirical evidence that single-neuron activations are weak but consistent signals for answer correctness in LLMs, with occasional neurons showing stronger specialization. It underscores the complexity of neural network internals and the challenge of pinpointing exact causal mechanisms.
DECODING INTELLIGENCE...