## Grid of Histograms: Neuron Activity Distributions for True vs. False Answers
### Overview
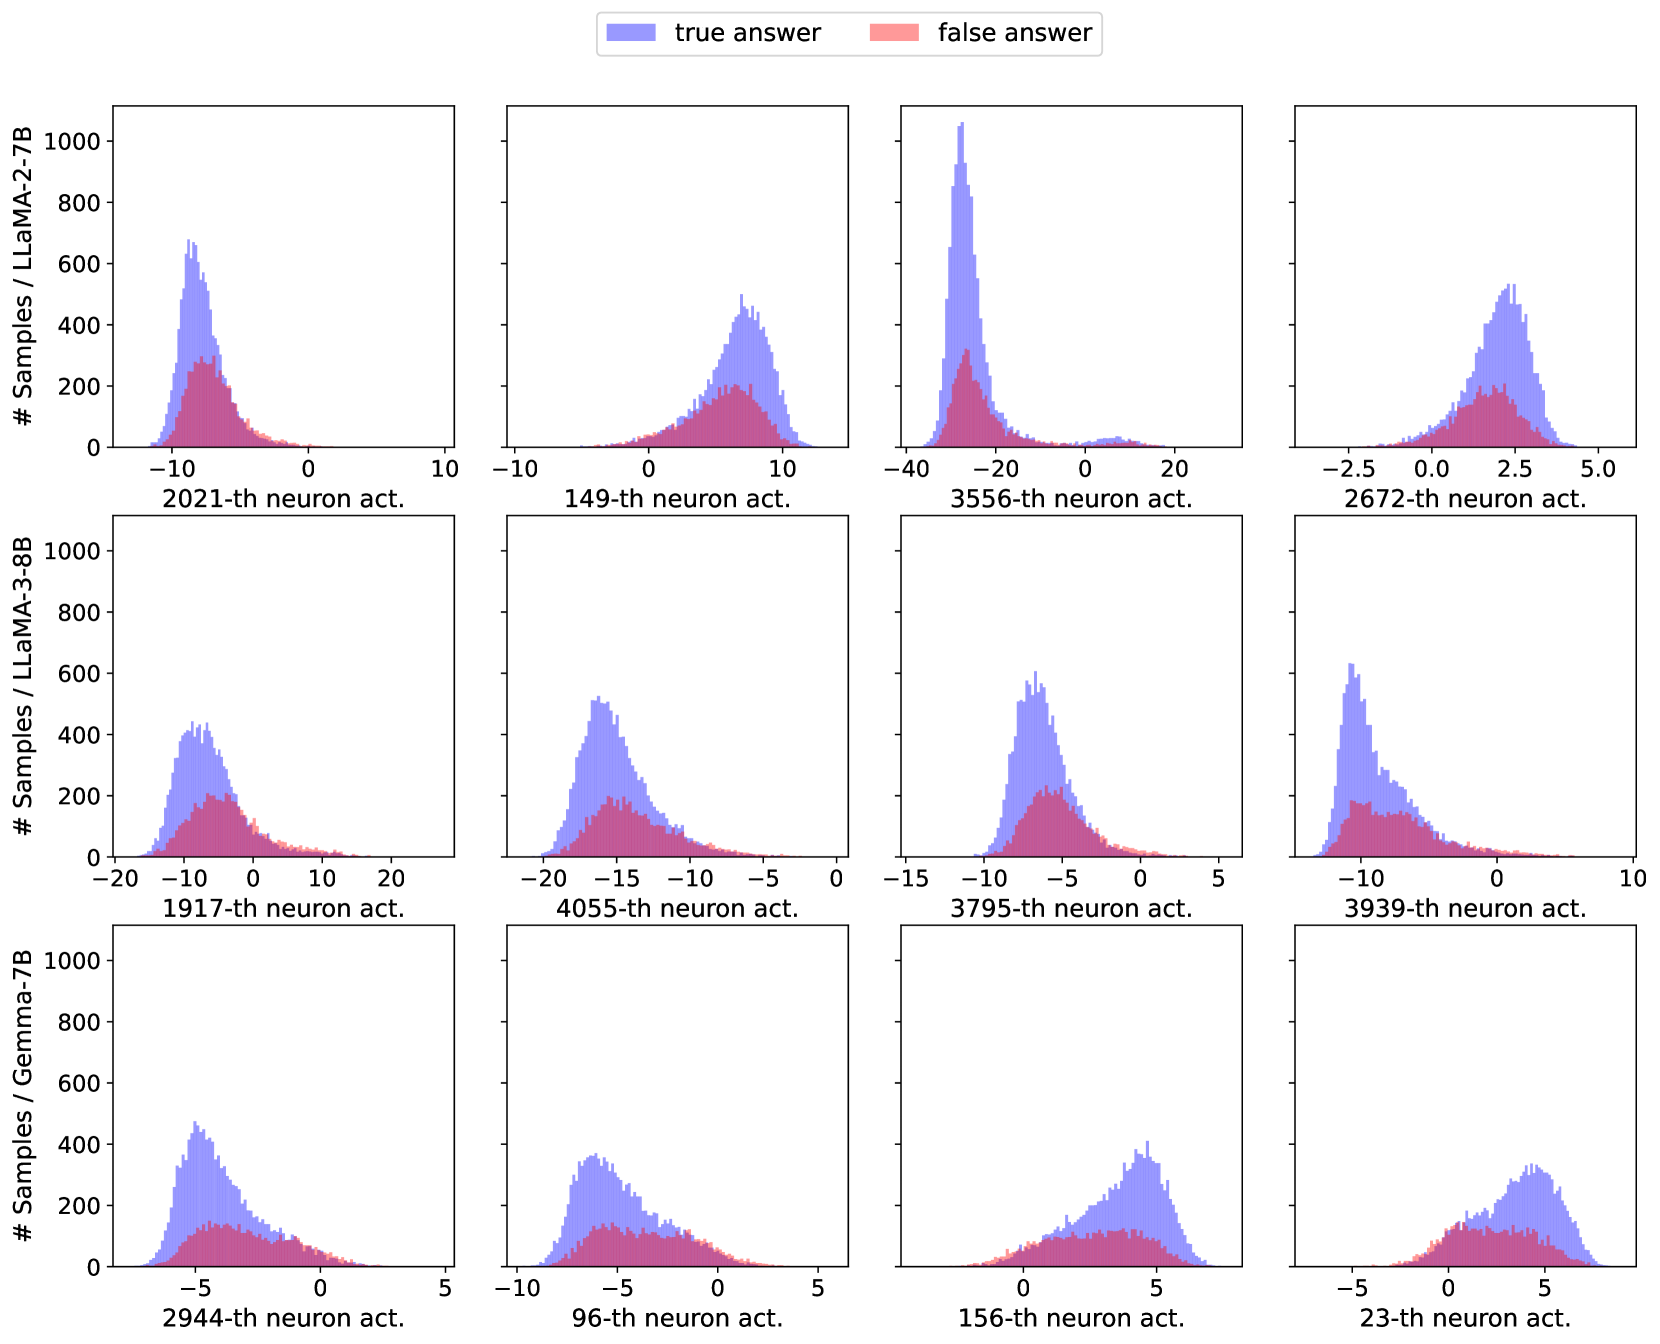
The image displays a 4x3 grid of histograms comparing neuron activity distributions for "true answer" (blue) and "false answer" (red) classifications. Each subplot corresponds to a specific neuron (e.g., "2021-th neuron act.") and visualizes the frequency of neuron activation values across samples. The histograms are normalized to show counts on the y-axis, with x-axis ranges varying per neuron.
### Components/Axes
- **Legend**: Located at the top center, with:
- **Blue**: True answer
- **Red**: False answer
- **X-axis**: Labeled "Neuron act." with ranges varying per subplot (e.g., -10 to 10, -40 to 20, -15 to 5).
- **Y-axis**: Labeled "# Samples / LLaMA-2-7B" for the first three rows and "# Samples / Gemma-7B" for the last row. Scales range from 0 to 1000.
- **Subplot Titles**: Each histogram is labeled with the neuron number (e.g., "2021-th neuron act.").
### Detailed Analysis
1. **2021-th neuron act.**:
- X-axis: -10 to 10
- Blue peak: ~0 (count ~600)
- Red peak: ~-5 (count ~300)
2. **149-th neuron act.**:
- X-axis: -10 to 10
- Blue peak: ~0 (count ~500)
- Red peak: ~-10 (count ~200)
3. **3556-th neuron act.**:
- X-axis: -40 to 20
- Blue peak: ~0 (count ~800)
- Red peak: ~-20 (count ~100)
4. **2672-th neuron act.**:
- X-axis: -15 to 5
- Blue peak: ~-10 (count ~400)
- Red peak: ~-15 (count ~150)
5. **1917-th neuron act.**:
- X-axis: -5 to 5
- Blue peak: ~0 (count ~450)
- Red peak: ~-5 (count ~200)
6. **4055-th neuron act.**:
- X-axis: -10 to 10
- Blue peak: ~-5 (count ~550)
- Red peak: ~-10 (count ~250)
7. **3795-th neuron act.**:
- X-axis: -5 to 5
- Blue peak: ~5 (count ~600)
- Red peak: ~0 (count ~300)
8. **2944-th neuron act.**:
- X-axis: -10 to 10
- Blue peak: ~0 (count ~500)
- Red peak: ~-5 (count ~250)
9. **96-th neuron act.**:
- X-axis: -10 to 10
- Blue peak: ~-5 (count ~450)
- Red peak: ~-10 (count ~200)
10. **156-th neuron act.**:
- X-axis: -5 to 5
- Blue peak: ~5 (count ~550)
- Red peak: ~0 (count ~300)
11. **3939-th neuron act.**:
- X-axis: -5 to 5
- Blue peak: ~5 (count ~600)
- Red peak: ~0 (count ~300)
12. **23-th neuron act.**:
- X-axis: -5 to 5
- Blue peak: ~5 (count ~550)
- Red peak: ~0 (count ~300)
### Key Observations
- **Peak Activity**: True answers (blue) generally show higher peak counts than false answers (red) across most neurons.
- **X-axis Variability**: Neuron activity ranges differ significantly (e.g., 3556-th neuron spans -40 to 20, while others are narrower).
- **Model-Specific Labels**: The last row uses "Gemma-7B" instead of "LLaMA-2-7B" for the y-axis, suggesting dataset/model differences.
- **Outliers**: The 3556-th neuron has the highest blue peak (~800 samples), indicating a strong signal for true answers.
### Interpretation
The histograms suggest that neuron activity patterns correlate with answer correctness. True answers often exhibit higher-frequency activation at specific values (e.g., near 0 or positive ranges), while false answers show lower or shifted peaks. The 3556-th neuron’s extreme blue peak implies it may be a critical feature for distinguishing correct responses. The shift in y-axis labels from LLaMA-2-7B to Gemma-7B in the final row hints at methodological changes or dataset variations between groups. These patterns could inform neural network interpretability or model debugging efforts.